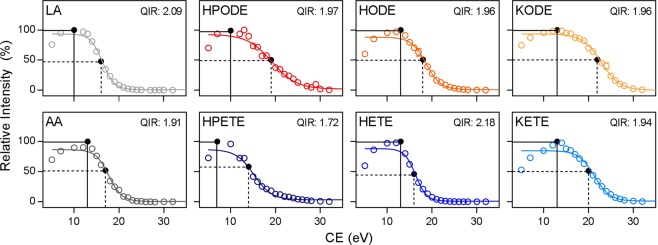
Figure 3.
Differential energy transition intensity curves for oxFA and unoxidized FA species. The curves were fit with a sigmoidal non-linear regression. The intensities are displayed relative to the highest intensity transition. The collision energy (CE) yielding the highest intensity transition was designated as the quantitative transition (solid line). The CE yielding an intensity of roughly 50% of maximal was designated at the qualitative transition (dashed line). The qualifier ion ratio (QIR) was calculated based on the intensities of these two transitions. Differential energy curves were performed in triplicate with data expressed as mean ± S.E.M.

