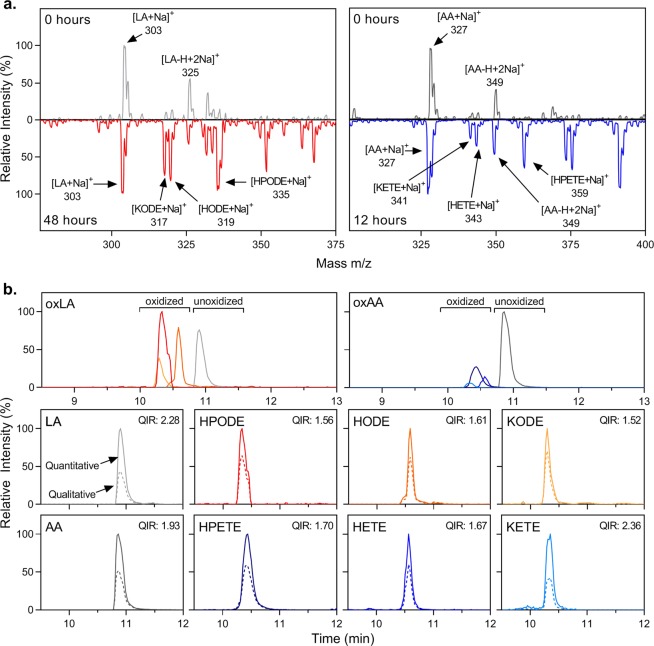
Figure 5.
Method validation with a complex mixture of species and regioisomers. (a) Full MS scan of oxFA mixtures produced by auto-oxidation of LA and AA for specified time period. Both unoxidized and auto-oxidized spectra were measured under the optimized conditions for the unoxidized species. Peak height is displayed relative to the highest intensity peak in the spectra. (b) Chromatograms of 100 μM auto-oxidized LA and AA for specified amount of time. Zoomed individual analyte chromatograms depict both the quantitative (solid line) and qualitative transitions (dashed line). Peak height is displayed relative to the highest intensity peak in each chromatogram.

