Figure 6.
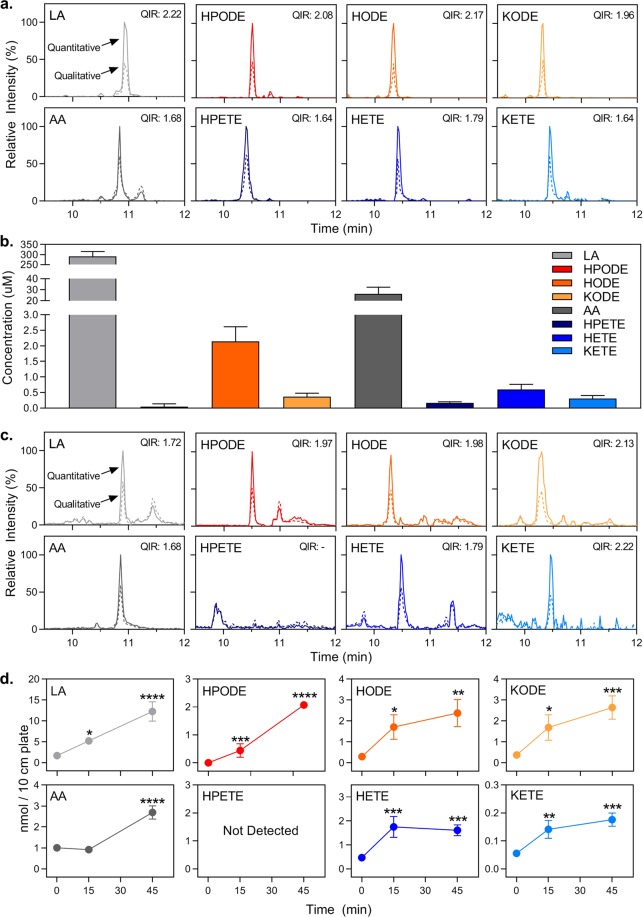
Quantification of oxFA species in biological samples. (a) Representative chromatogram of oxFA in basal mouse serum samples. Quantitative (solid line) and qualitative transitions (dashed line) visualized with the calculated QIR. Peak height is displayed relative to the highest intensity peak in each chromatogram. (b) Concentration of oxFA in mouse serum. Blood was collected by cardiac puncture from anesthetized mice. Serum was isolated, subjected to a lipid extraction, and measured by HPLC-MS/MS. Data shown is from 12 mice and expressed as mean ± S.E.M. (c) Representative chromatogram of oxFA in 3T3-L1 cell media samples. Quantitative (solid line) and qualitative transitions (dashed line) visualized with the calculated QIR. Peak height is displayed relative to the highest intensity peak in each chromatogram. (d) Levels of oxFA released from 3T3-L1 adipocytes into cellular media during lipolysis. 3T3-L1 adipocytes were serum starved in high glucose DMEM + 0.5% FA-free BSA for 1 h before being treated with 10 μM isoproterenol to stimulate lipolysis. Media was collected after 0, 15, and 45 min of treatment, subjected to a lipid extraction, and measured by HPLC-MS/MS. Cellular treatments and analysis were performed in quadruplicate with data expressed as mean ± S.E.M. Asterisks indicate significant difference compared to 0 min (*p < 0.05, **p < 0.01, ***p < 0.001, ****p < 0.0001, respectively).

