Figure 2.
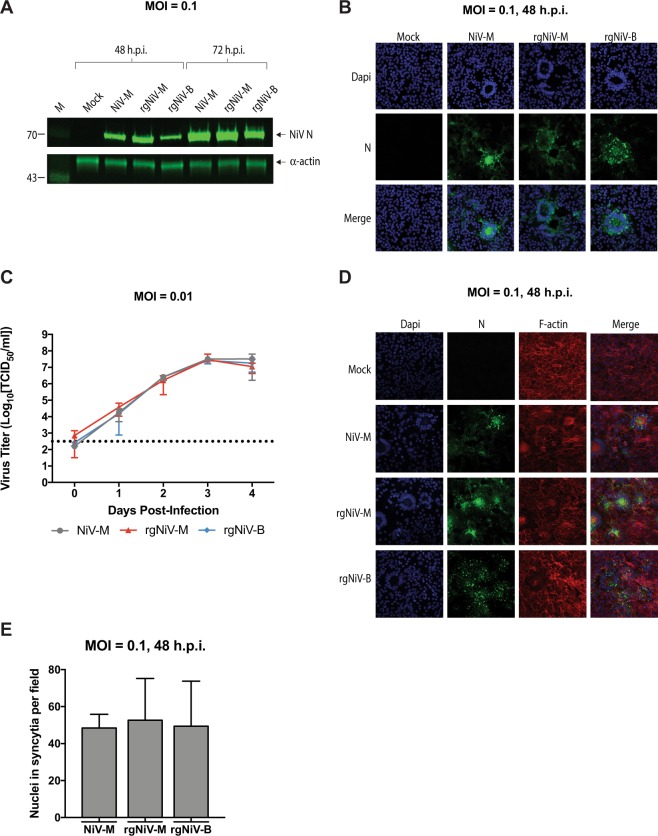
Characterization of reverse-genetics derived NiVs. (A) Western blot analysis of the NiV nucleoprotein (N) from infected cell lysates. Vero E6 cells were mock-infected, infected with NiV-M isolate, rgNiV-M, or rgNiV-B (MOI = 0.1), and lysates were harvested 48 hours later. Lysates were subjected to SDS-PAGE followed by Western blotting and were probed a monoclonal antibody against the N protein of NiV-M. α-actin served as a loading control. The lysates were run on duplicate SDS-PAGE gels and the respective Western blots were stained for NiV N or α-actin. Protein standards are in lane 1 and the band sizes are indicated in kilodaltons. (B) Immunofluorescence analysis of Vero E6 cells that were mock-infected, infected with NiV-M, rgNiV-M, or rgNiV-B. Cells were fixed 48 hours after infection and were subsequently stained with monoclonal antibody against the N protein and visualized by confocal microscopy. (C) Growth kinetics of NiV-M and reverse genetics-derived NiV. Vero E6 cells were infected with NiV-M, rgNiV-M, or rgNiV-B at an MOI of 0.01. Supernatants were collected at the indicated days post-infection and titrated by standard TCID50 analysis in VeroE6 cells. The mean and standard deviations from three biological replicates are shown. The dashed line indicates the limit of detection for the assay. (D) Fusogenicity of wildtype NiV-M and reverse-genetics derived NiVs. Vero E6 cells were mock-infected, infected with NiV-M, rgNiV-M, rgNiV-B (MOI = 0.1) and cells were fixed 48 hours later. To reveal the presence of infected cells with multinucleated syncytia, fixed cells were stained with Mab against the N protein (green), phalloidin to detect F-actin (red), allowing for the demarcation of individual cells, and DAPI to detect nuclei (blue). (E) Cells with three or more nuclei within an N protein positive cell were counted in five different fields (magnification, x40) per treatment. Bars indicate mean values and error bars indicate s.d. Scale bars, 2 mm in b and d. Statistical differences were not significant as determined by the student T test (p > 0.05). The limit of detection for the TCID50 assays was 102.5 TCID/ml.

