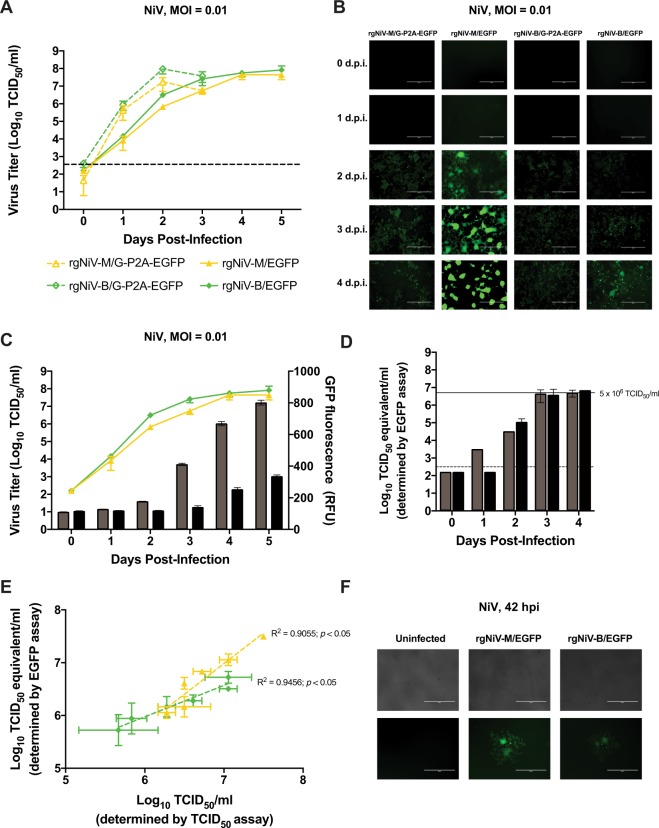
Figure 4.
Characterization of recombinant, EGFP-expressing NiVs. (A) Growth kinetics of recombinant NiV expressing EGFP. Vero E6 cells were infected with rgNiV-M/G-P2A-EGFP, rgNiV-M/EGFP, rgNiV-B/G-P2A-EGFP, or rgNiV-B/EGFP at an MOI of 0.01. Supernatants were collected at the indicated days post-infection and titrated by standard TCID50 analysis in VeroE6 cells. The mean and standard deviation from three biological replicates are shown. The dashed line indicates the limit of detection for the assay. (B) Epifluorescence microscopy of cells infected with EGFP-expressing NiVs. Vero E6 cells were infected with rgNiV-M/G-P2A-EGFP, rgNiV-M/EGFP, rgNiV-B/G-P2A-EGFP, or rgNiV-B/EGFP at an MOI of 0.01 and representative images were taken of EGFP expression. (C) Quantification of EGFP expression in rgNiV-M/EGFP or rgNiV-B/EGFP-infected cells. EGFP activity resulting from the infection of Vero E6 cells with rgNiV-M/EGFP (grey bars) or rgNiV-B/EGFP (black bars) at a MOI of 0.01 was measured daily for five days using a fluorescence-based microplate reader and plotted against viral titer in rgNiV-M/EGFP (yellow line or rgNiV-B/EGFP-infected supernatants (green line), as described above (same viral titer data as panel A). (D) EGFP-based TCID50 assay. A TCID50 assay using EGFP as a readout was carried out on rgNiV-M/EGFP (grey bars) or rgNiV-B/EGFP samples (black bars) of known concentration diluted to 5 × 10⁶ TCID50/ml, indicated by a solid line. Fluorescence foci were identified on the indicated days post-infection and the TCID50/ml equivalent titers of the input were calculated. The dashed line indicates the limit of detection for the assay. Bars indicate mean values and error bars indicate s.d. from four replicates. (E) Comparison of EGFP-based titration assay and conventional TCID50 assay. Samples containing two-fold dilutions of rgNiV-M/EGFP (yellow line) or rgNiV-B/EGFP (green line) were titrated in duplicate by the EGFP-based titration assay at three dpi and a conventional TCID50 assay at five dpi and were plotted on the same graph. The dashed line indicates the line of best fit, and the R2 value is given. (F) Fluorescence foci in rgNiV-M/EGFP or rgNiV-B/EGFP-infected cells. Vero E6 cells were mock-infected or infected with the respective viruses at an MOI of 0.01 and representative images were taken of EGFP expression at 48 hpi. Bars indicate mean values and error bars indicate sd. The limit of detection for the TCID50 assays was 102.5 TCID/ml.

