Figure 1.
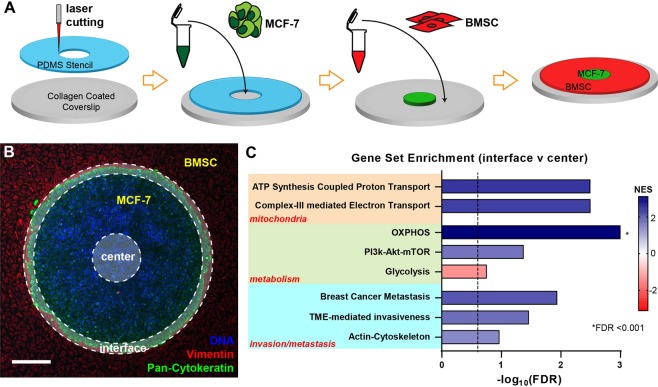
Spatial regulation of mitochondrial, metabolic, and metastatic pathways in micropatterned tumor-stromal assays (µTSA) assessed by RNA sequencing. (A) Schematics depicting the steps to create a MCF-7/BMSC µTSA; (B) Representative micropattern of an MCF-7 island (green: Pan-Cytokeratin) surrounded by BMSCs (red: Vimentin). Blue: nuclei. Scale bar: 100 μm. Cancer cells from the center and edge of the µTSA (opaque annular ring with dotted outlines) were isolated by laser capture microdissection17, and their RNA was extracted and sequenced; (C) Gene sets found to be enriched at the interface vs. center by RNA sequencing and gene set enrichment analysis (glycolysis has negative NES indicating enrichment in the center). (See Methods for more details. FDR: False Discovery Rate; FDR < 0.25 was considered significant.) MCF-7 cells from >6 micropatterns/experiment were microdissected and combined before RNA isolation and sequencing; N = 2 independent experiments.

