Figure 2.
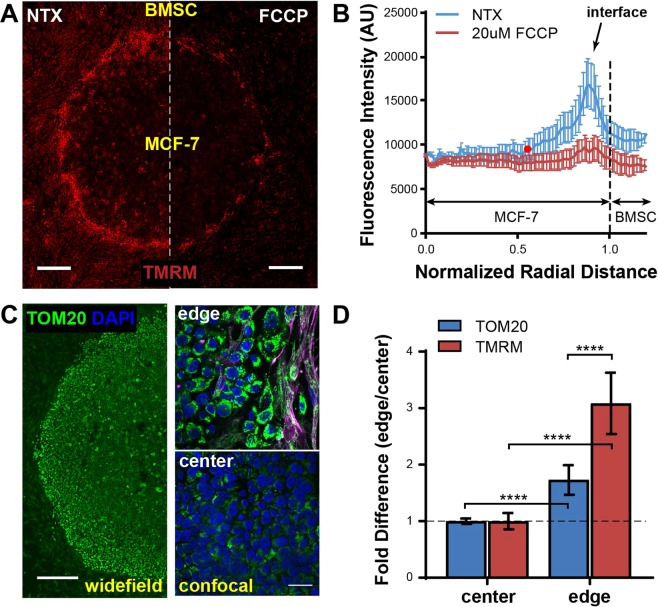
Differential regulation of mitochondrial membrane potential (ΔΨm) and mass at the interface vs. center in the µTSA. (A) ΔΨm levels assessed by TMRM fluorescence on Day 4 MCF-7-BMSC µTSA before and after addition of 20 μM FCCP uncoupler. Scale bar: 500 μm; (B) Representative radial distribution of TMRM fluorescence in a MCF-7-BMSC µTSA on day 4 before and after FCCP treatment. The red dot (r = 0.52) on the no-treatment (NTX) curve indicates that the TMRM fluorescence to the right of the dot is significantly higher than that of all FCCP-treated samples; from N = 6 independent experiments (p < 0.05, Welch’s t-test); (C) µTSA stained for mitochondrial mass with anti-TOM20. Right panels: confocal scans of the edge and the center. Green: TOM20; purple: vimentin; blue: DAPI. Scale bars: 500μm in widefield (left) and 25μm in confocal (right). (D) Fold difference in TMRM and TOM20 fluorescence between the edge and the center. N = 3 independent experiments. P-values: ordinary one-way ANOVA.

