Figure 4.
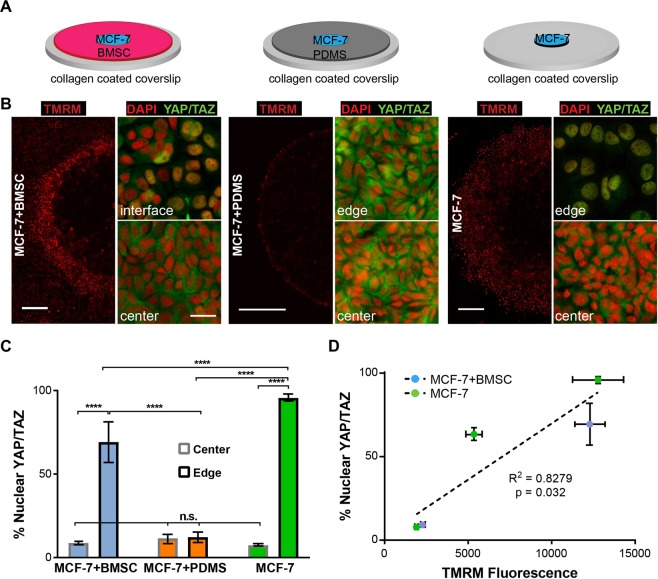
Correlation of ΔΨm and YAP/TAZ nuclear translocation in micropatterns. (A) Schematics of the three micropattern cultures used in this experiment; (B) TMRM staining of ΔΨm (scale bar: 500 μm) and YAP/TAZ immunostaining (scale bar: 25 μm) in the three micropatterns on day 4; (C) Quantification of cancer cells with nuclear YAP/TAZ localization at the center and edge of the µTSA (n.s.: not significant; ****p < 0.0001 by ordinary one-way ANOVA); Representative dataset from N = 3 independent experiments. (D) Linear regression of YAP/TAZ nuclear localization and TMRM fluorescence in cancer cells in the monoculture and co-culture µTSA. Three locations (center, edge and approximately 700 μm away from the edge) were taken from the monoculture µTSA and two locations (center and edge) from the co-culture. (Representative dataset, N = 2 independent experiments; p-value: zero-slope hypothesis in linear regression).

