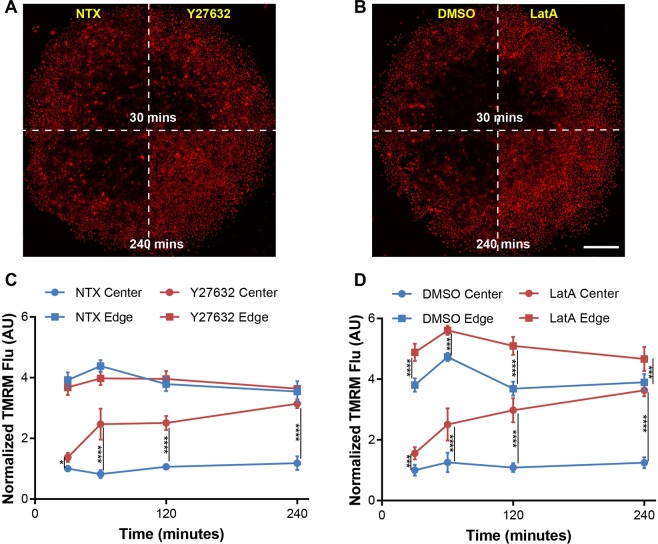
Figure 6.
Loss of ΔΨm heterogeneity by inhibition of mechanotransduction. (A,B) TMRM fluorescence in monoculture µTSA on day 4 treated with inhibitors of mechanotransduction: Y-27632 (50 μM, ROCK inhibitor) and Latrunculin A (LatA, 0.5 μM, actin polymerization inhibitor) from 30 to 240 minutes. Scale bar: 500 μm; (C,D) Changes of TMRM fluorescence in cancer cells at the center and edge as a function of treatment time (Representative dataset from N = 3 independent experiments; *p < 0.05, ***p < 0.001, ****p < 0.0001, by ordinary one-way ANOVA).

