Figure 1.
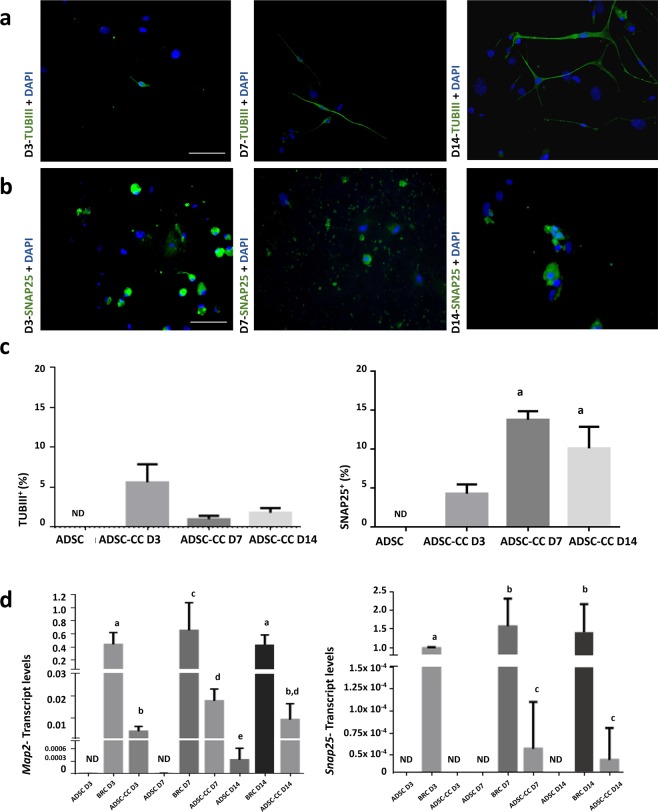
Immunocytochemistry and flow cytometry analysis of SNAP25 and TUBIII, and transcript levels of Map2 and Snap25. (a) SNAP25+ ADSC-CCs on days 3, 7, and 14, indicating the capacity of BRC to induce the differentiation of ADSC when in co-culture. (b) TUBIII+ ADSC-CCs on days 3, 7, and 14, indicating the capacity of BRC to induce the differentiation of ADSC when in co-culture. (c) Graphs show the percentage of positive cells for TUBIII (left) and for SNAP25 (right) on days 3, 7 and 14. (d) Graph on the left shows transcript levels of Map2, demonstrating an increase on day 7 compared to day 3 and graph on the right shows transcript levels of Snap25, demonstrating an increase on day 7 compared to day 3. TUBIII- beta tubulin III; SNAP25- synaptosomal-associated protein 25. Map2- microtubule-associated protein 2. Different letters indicate p < 0.05. Graph bars correspond to standard error. Bar = 100 µm.

