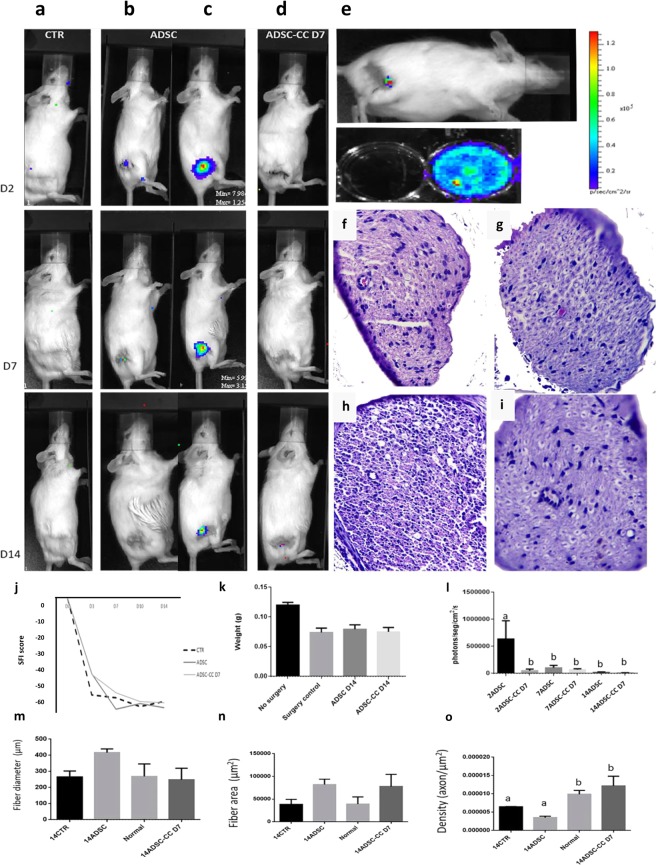
Figure 4.
Co-cultured ADSC local environment improvement in vivo. (a) Example IVIS analysis of the CTR (control group) surgery without stem cell application group. (b,c) Example IVIS analysis of the surgery with ADSC application group. (d) Example IVIS analysis of the surgery with ADSC-CC D7 application group. (e) ADSCs-CC D7 were bioluminescent after the differentiation process, and after the application, few bioluminescence was acquired. Signal close to red indicate more bioluminescence and closer to blue indicate few bioluminescence. (f) Histology of the sciatic nerve of CTR group (g) Histology of the sciatic nerve of ADSC group. (h) Histology of the sciatic nerve of no surgery group (Normal). (i) Histology of the sciatic nerve of ADSC-CC D7 group. (j) Evaluation of sciatic nerve index (SFI) - Differences between SFI in the groups evaluated. Animals that received ADSC-CC D7 showed an improvement in SFI when compared to the other treatments, even though no statistical difference was observed (p ≤ 0.05). (k) On the first day of analysis (seventh postoperative day) there were marked differences between the group ADSC-CC D7 and the group ADSC on the wet weight of the gastrocnemius muscle, but over time there were no differences between the experimental groups. (l) Graph of IVIS analysis, there was more detectable signal on the ADSC than CTR and ADSC-CC D7. (m,n) There was no statistical difference between fiber diameter and (m) area (n) however there was more axon density (o) on the ADSC-CC D7 group than ADSC, equal value to the normal nerve without neurotmesis, Different letters within the same graph indicate statistical differences (p ≤ 0.05). The bars correspond to the means and the smaller bars are the standard error of the mean.

