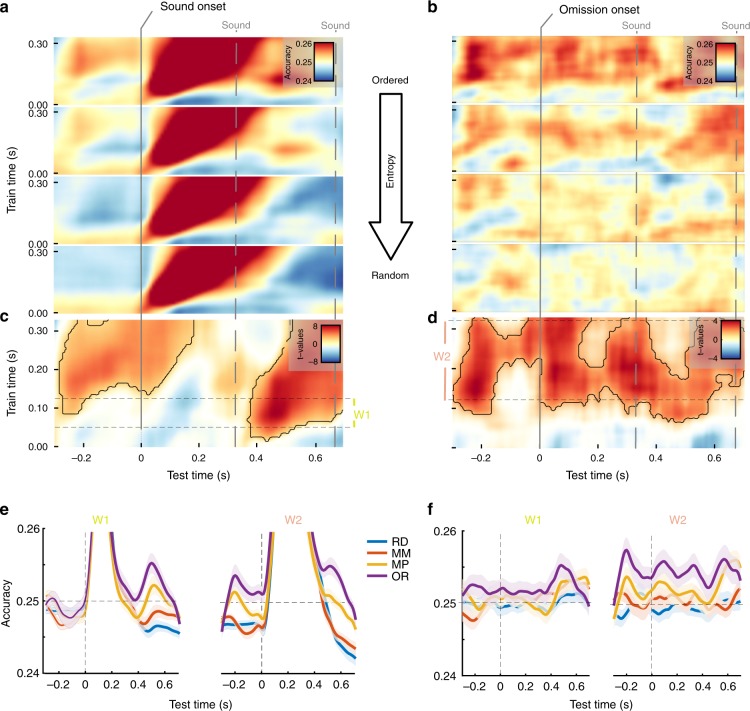
Fig. 3.
Analysis for pre- and post-stimulus decoding using time-generalization of classifier trained on random sound sequences. a, b “Raw” decoding time-generalization maps (grand average across subjects), tested on sound- (a) and omission- (b) locked trials, in increasing entropy from top to bottom. c, d Regression results (sound left, omission right), using entropy level as the independent variable; red colors indicate increased decoding accuracy for more regular sequences. t-values are thresholded at uncorrected p < 0.05. The areas framed in black are clusters significant at pcluster < 0.05. e, f Decoding accuracy for individual conditions averaged for training times between the dashed lines, testing on sound (left) and omission (right). c Display of effects pre- and post-sound, showing a clear anticipation effect and a late effect commencing after ~400 ms. The latter effect is more clearly visualized in (e). Interestingly, different train times appear to dominate the anticipation and post-stimulus effects. d Display of effects pre- and post-omission, showing a single continuous positive cluster. However, the actual t-values suggest temporally distinct maxima within this cluster underlining the dynamics around this event. Analogous to sounds a clear anticipation effect can be observed, driven by increased pre-omission decoding accuracy for events embedded in regular sequences (see f). A similar increase can be seen immediately following the onset of the omission which cannot be observed following actual sound onset. Interestingly this increase is long lasting with further peaks emerging approximately at 330 ms and 580 ms

