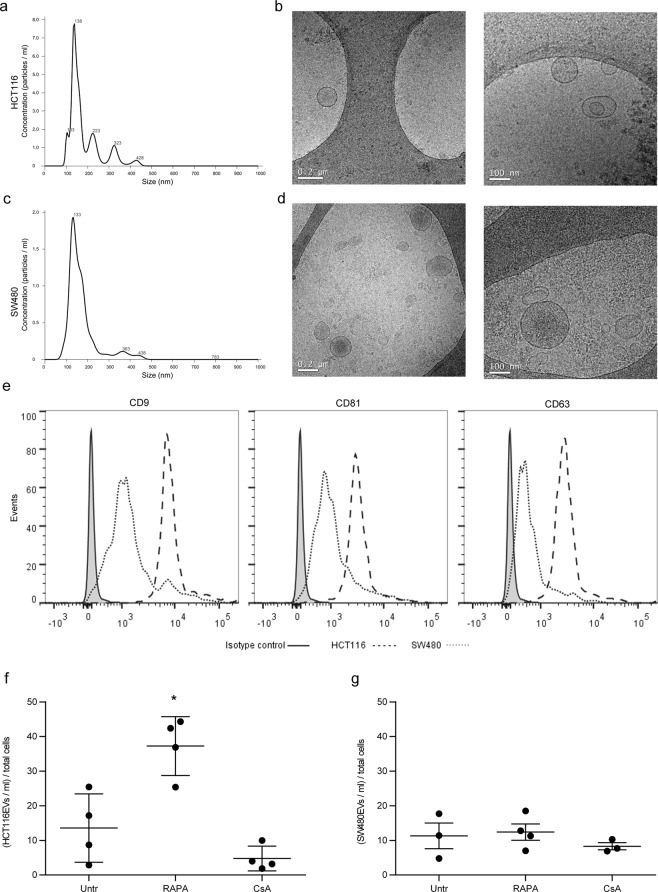
Figure 1.
Characterization of extracellular vesicles from HCT116 and SW480 cell lines under rapamycin and cyclosporine A. Characterization of EVs released by HCT116 and SW480 CRC cell lines. (a,c) NTA measurement shows the concentration and size distribution of (a) HCT116EVs and (c) SW480EVs. (b,d) Images from cryo-electron microscopy of purified (b) HCT116EVs and (d) SW480EVs (scale bars 0.2 and 0.1 μm. (e) Bead-based flow cytometry analysis of HCT116EVs and SW480EVs stained with EV markers: CD9, CD81, and CD63. (f,g) EV production in Untr, RAPA, and CsA treatment was calculated as EVs/ml per total cells in HCT116 and SW480. Data are expressed as the mean ± SD. (n = 4). *P < 0.05 versus Untr (untreated) by Student’s t-test.

