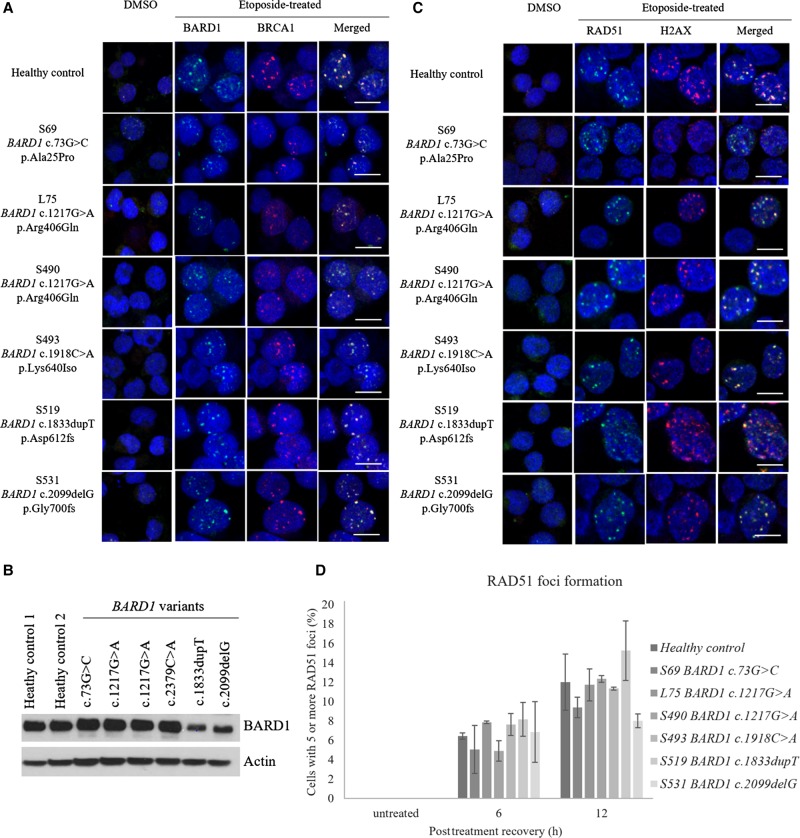
Figure 2.
(A) BARD1–BRCA1 colocalization was observed for all the BARD1 variants. BARD1 and BRCA1 foci were stained green and red, respectively. (B) Basal levels of BARD1 expression were lower in BARD1 c.1833dupT and BARD1 c.2099delG as compared to healthy controls. (C,D) RAD51 foci (green) were colocalized at the sites of DNA breaks as represented by ɣ-H2AX foci (red). Scale bar, 10 µm. No statistically significant difference in RAD51 localization was noted between the BARD1 variants and the healthy controls. An independent t-test was used to compare the results between the variants and healthy controls.

