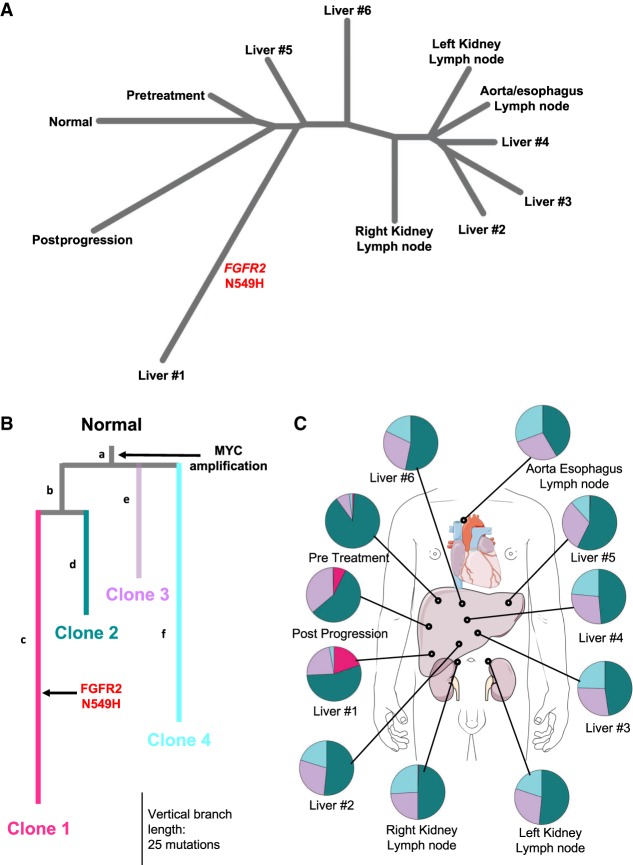
Figure 3.
Analysis of tumor heterogeneity. (A) Neighbor-joining tree over sets of somatic SNVs in each of 11 tumor samples, with normal defined as the empty set. (B,C) Subclonal inference from Canopy. Colors in B correspond to subclones in C. Letters identify branches of the tree. (B) Phylogenetic tree assessment with Canopy revealed four major clonal populations of cells. Each subclone is characterized by a group of mutations. MYC gain was truncal to all subclones. Clone 1 (pink) contained a unique FGFR2 N549H point mutation. Vertical distance corresponds to increased number of somatic mutations (SNVs and indels). (C) Prevalence of four tumor subclones within tumor samples.

