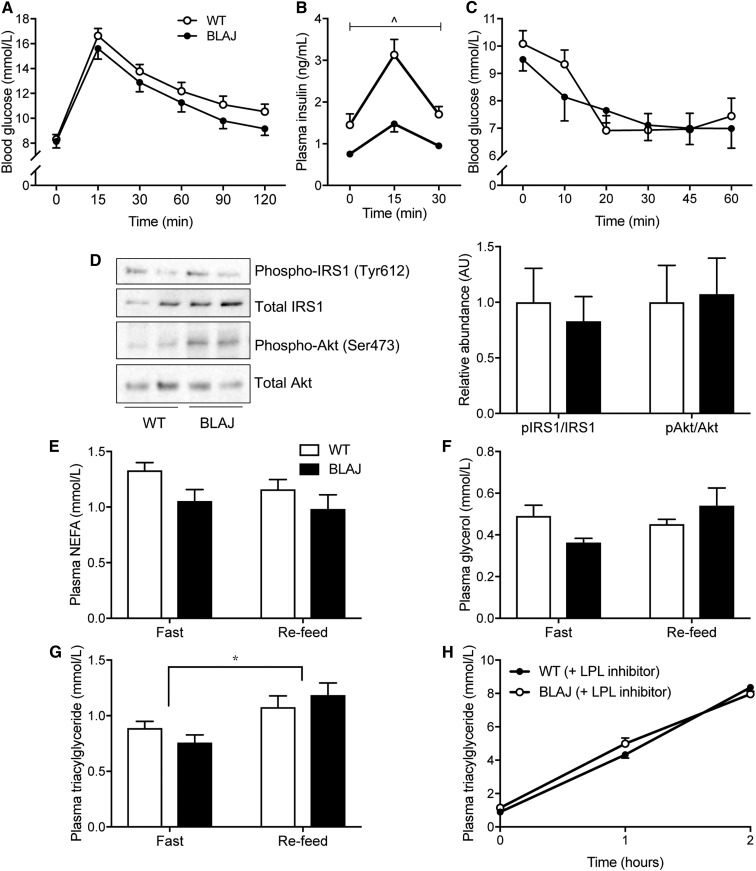
Fig. 2.
Glucose metabolism and blood lipids. Measurements made in WT and Dysf-deficient BLAJ mice aged 13 weeks. A: Blood glucose before and during an oral glucose tolerance test. B: Plasma insulin levels assessed before and after oral glucose administration. C: Blood glucose levels before and during an intraperitoneal insulin tolerance test, n = 12 WT and n = 8 BLAJ mice. D: Insulin-stimulated phosphorylation of Akt (Ser473) to total Akt and phosphorylation of IRS1 (Tyr 612) to total IRS1 in liver homogenates. The blot is representative of n = 7 WT mice and n = 7 BLAJ mice. E–G: Fasting and refed plasma NEFA, glycerol, and TG levels, respectively, n = 8 WT and 8 BLAJ mice. H: Plasma TG during the TG secretion test, n = 8 WT and 8 BLAJ mice. Data are means ± SEMs. ^P < 0.05 genotype effect as assessed by two-way repeated-measures ANOVA (B); *P < 0.05 feeding effect as assessed by two-way ANOVA (G). AU, arbitrary unit; IRS1, insulin receptor substrate 1.

