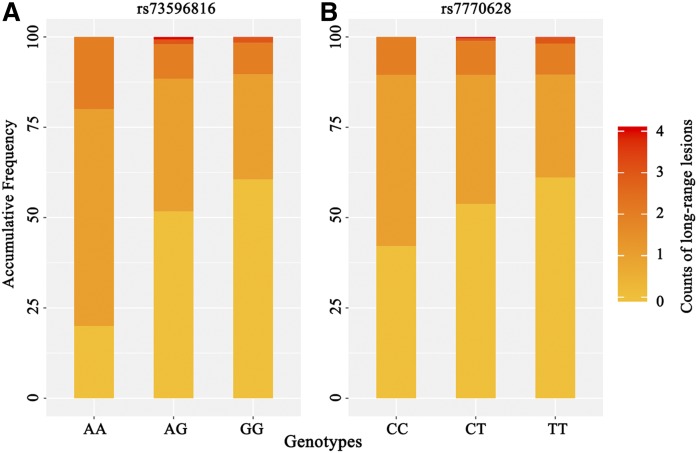
Fig. 3.
Bar plots of two SNPs associated with count of LRLs. Each bar shows the proportion of harboring different counts of LRLs in each genotype (the darker the color of the block, the more LRLs it has). Both plots indicate that individuals carrying alleles with minor frequency are likely to be harboring more LRLs. Minor frequency alleles are A and C for rs73596816 (A) and rs7770628 (B), respectively.

