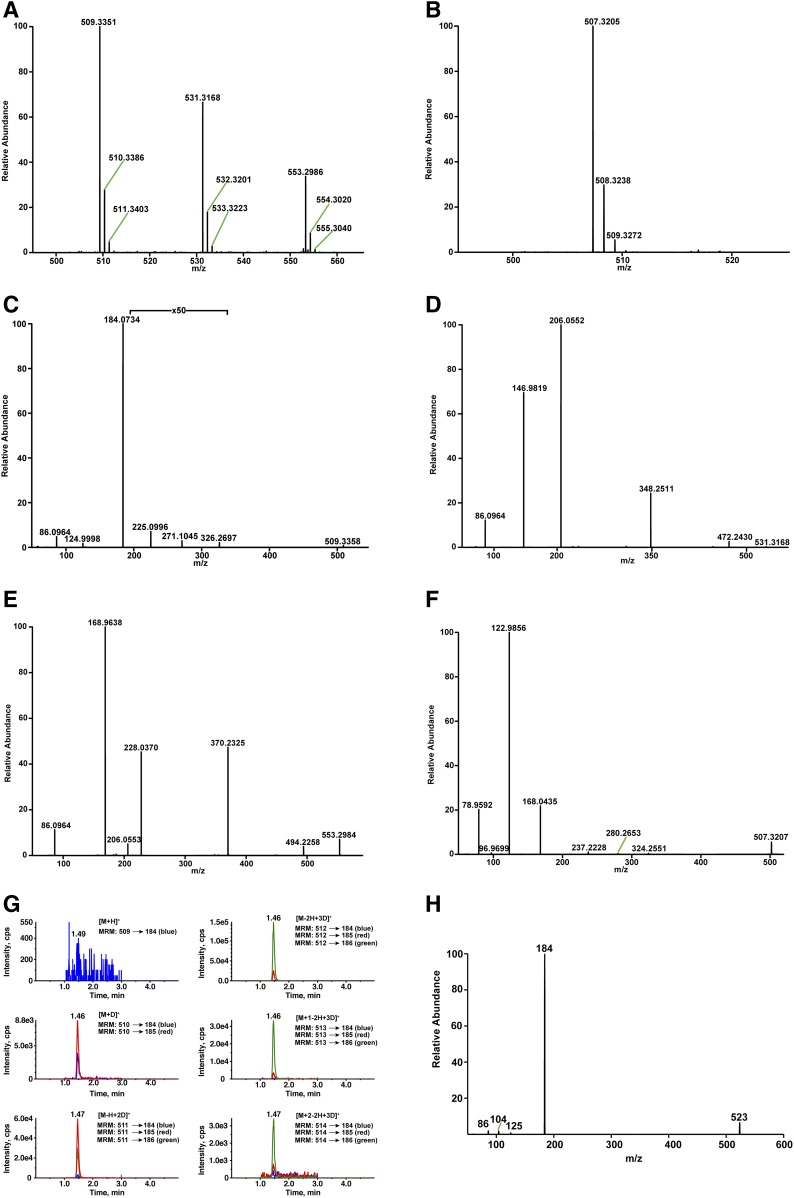
Fig. 2.
Identification of the structure of lysoSM-509. A: High-resolution mass spectrum of endogenous lysoSM-509 in positive ion mode. B: High-resolution mass spectrum of endogenous lysoSM-509 in negative ion mode. C: High-resolution product ion spectrum of the [M+H]+ ion of endogenous lysoSM-509. D: High-resolution product ion spectrum of the [M+Na]+ ion of endogenous lysoSM-509. E: High-resolution product ion spectrum of the [M+2Na-H]+ ion of endogenous lysoSM-509. F: High-resolution product ion spectrum of the [M-H]− ion of endogenous lysoSM-509. G: H/D exchange of endogenous lysoSM-509 detected with MRM. The [M-2H+3D]+ ion at m/z 512 shows the maximum intensity. H: Product ion spectrum of the [M+H]+ ion of endogenous lysoSM-509 methyl ester.

