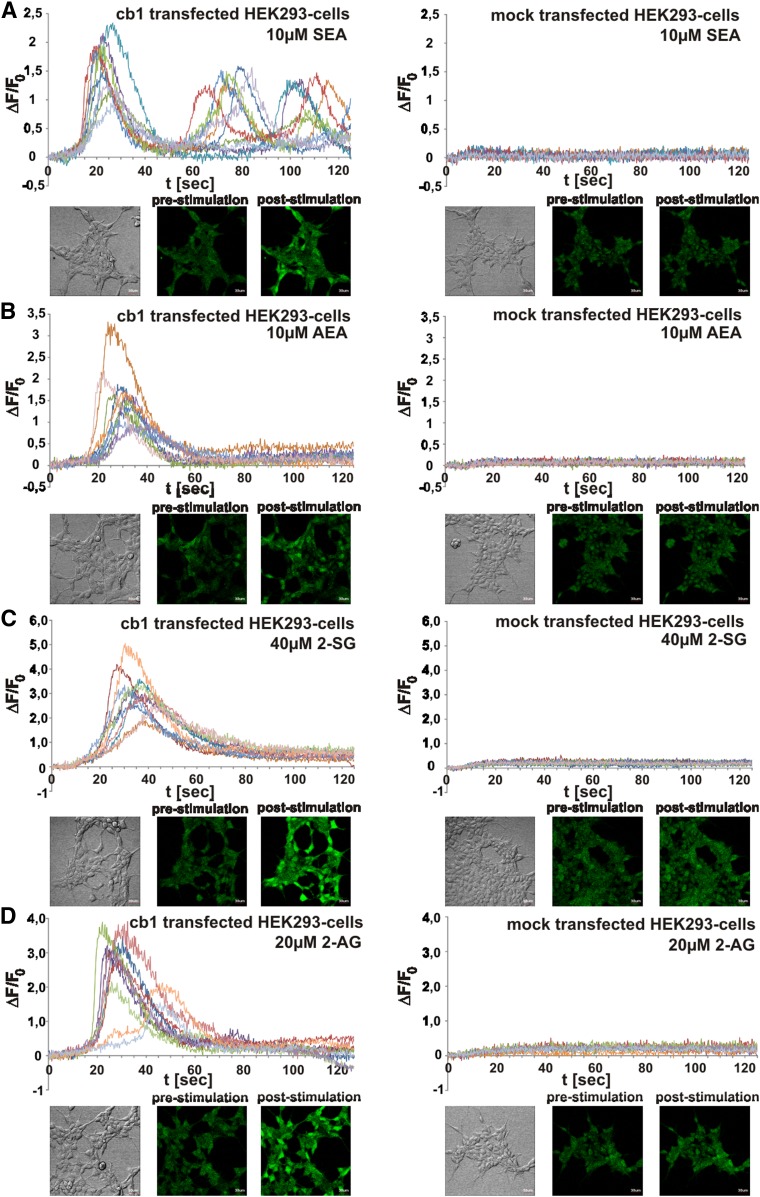
Fig. 6.
Analysis of activator function of endocannabinoids SEA and 2-SG compared with AEA and 2-AG in cb1- and mock-transfected HEK293 cells by comparative Fluo-4 imaging. A–D: Fluorescent signals of CB1 agonist-induced Ca2+ transients in each of 10 randomly selected HEK293 cells were monitored after SEA (A), AEA (B), 2-SG (C), and 2-AG (D) addition. Time-dependent corrected relative intensities (ΔF/F0) and pictures at zero time (pre-stimulation) and at peak activity (post-stimulation) are presented (n = 10).

