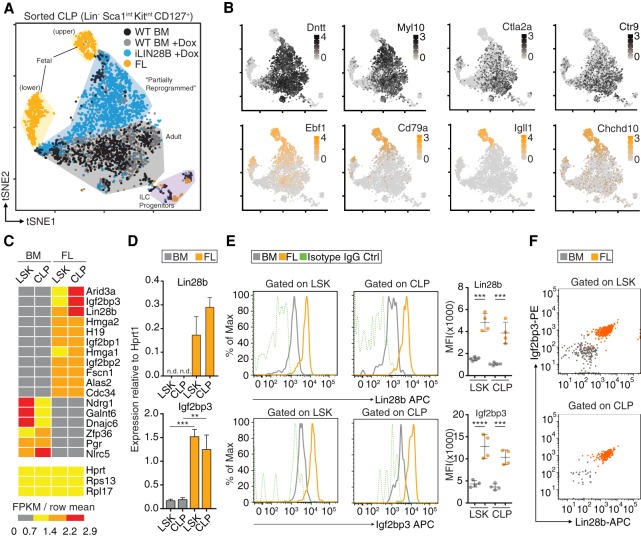
Figure 1.
Expanding the Lin28b GRN. (A) The composite t-SNE plot depicts 3832 individual CLP cells color-coded by sample and comprising the following: 858 from adult BM of wild-type (WT) mice (black), 1083 from adult BM of WT mice treated with Dox (gray), 1238 from adult BM of iLIN28B mice treated with Dox (blue), and 653 from FLs of WT mice (orange). A few contaminating cells have been labeled as presumptive ILC progenitors based on gene expression. (B) The t-SNE plots are the same as in A, but color intensities represent log-normalized mRNA levels of the indicated marker genes for adult BM CLPs (gray; top row) and FL CLPs (orange; bottom row) in individual cells. (C) The heat map shows expression patterns of select transcripts from low-input RNA-seq of lineage-negative (Lin−) Sca1+ c-kit+ (LSK) and CLP cells sorted from FL or BM. Three housekeeping transcripts are included as controls. For each transcript, the ratios of FKPM (fragments per kilobase of transcript per million mapped reads) in sample over the row mean are plotted according to color scale. (D) The RT-qPCR analyses quantify Lin28b and Igf2bp3 mRNA expression normalized to Hprt1 in LSK and CLP cells sorted from FL or BM. (n.d.) Not detectable; (**) P ≤ 0.01; (***) P ≤ 0.001, two-tailed t-test. Error bars represent standard deviation of three biological replicates. (E) The histograms show Lin28b and Igf2bp3 expression in LSK and CLP cells from BM (gray) and FL (orange) based on FACS. Isotype IgG controls are also shown (green, dashed). The geometric means of fluorescence intensities (MFI) from biological replicates are plotted. (***) P ≤ 0.001; (****) P ≤ 0.0001, two-tailed t-test. Error bars represent standard deviation of four to five biological replicates. (F) The dot plots quantify Lin28b (X-axis) and Igf2bp3 (Y-axis) protein coexpression in LSK and CLP cells from BM and FL based on FACS. Results are representative of two independent experiments. Dots represent individual cells color-coded by sample.

