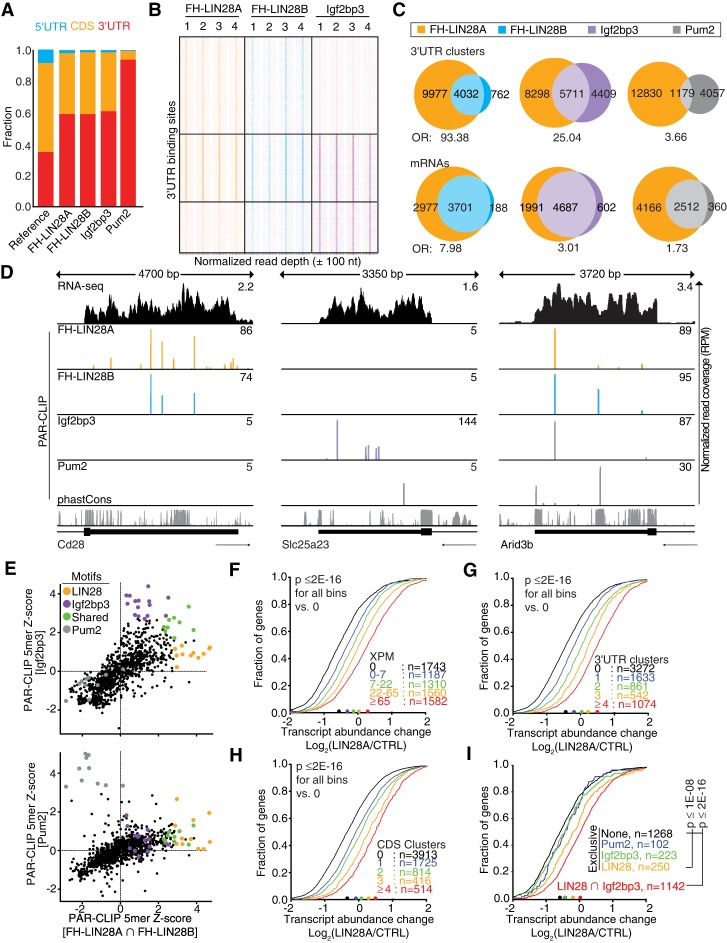
Figure 3.
Lin28- and Igf2bp3-binding sites overlap extensively across the transcriptome. (A) Distributions of PAR-CLIP binding sites for FH-LIN28A/B, Igf2bp3, and Pum2 across mRNA exonic regions (5′ UTR, CDS, and 3′ UTR) are plotted. The reference bar shows the estimated fraction of each region within the transcriptome. (B) The heat map compares PAR-CLIP sequence read coverage centered (±100 nucleotides [nt]) around 3′ UTR-binding sites of FH-LIN28A (orange), FH-LIN28B (cyan), and Igf2bp3 (purple). Each column represents data from an independent PAR-CLIP experiment (replicates 1–4), and each row represents a specific 3′ UTR segment. Boxes separate distinctive target categories: LIN28-preferred (8352 rows), LIN28–Igf2bp3 shared (5711 rows), and Igf2bp3-preferred (4439 rows). The color intensities vary with PAR-CLIP read depth. (C, top panel) Venn diagrams show FH-LIN28A PAR-CLIP 3′ UTR-binding sites (clusters) overlapping by at least 1 nt with FH-LIN28B, Igf2bp3, and Pum2, respectively. (Bottom panel) Venn diagrams show mRNAs cotargeted by FH-LIN28A and FH-LIN28B, Igf2bp3, or Pum2, respectively. The OR of each overlap is indicated. (D) The genome browser tracks show the last exon for three exemplary mRNAs with LIN28A/B-exclusive (Cd28; left), Igf2bp3-exclusive (Slc25a23; middle), or shared binding sites (Arid3b; right). Binding sites from Pum2 PAR-CLIP are shown as a specificity control. The tracks showing PAR-CLIP sequence read coverage are colored by RBP. (Orange) LIN28A; (cyan) LIN28B; (purple) Igf2bp3; (gray) Pum2. RNA-seq coverage in 220-8 cells and the phastCons evolutionary conservation score for 21 mammalian genomes (Euarchontoglire clade) are shown in the top (black) and bottom (gray) tracks, respectively. (E) The dot plots depict Z-scores for the occurrence of all 1024 possible 5-mers in PAR-CLIP binding sites shared by LIN28A and LIN28B (FH-LIN28A ∩ FH-LIN28B) compared with Igf2bp3-binding sites (top panel) or Pum2-binding sites (bottom panel). The color code indicates 5-mers enriched in Igf2bp3 (purple), LIN28A/B (orange), both (green), or Pum2 PAR-CLIP experiments (gray). The sequences of top-scoring 5-mers are in Supplemental Table 6. (F–I) Cumulative distribution of log-transformed fold changes of mRNA expression comparing LIN28A transduced and empty vector transduced 220-8 cells determined by RNA-seq. FH-LIN28A target mRNAs were binned based on the number of cross-linked reads normalized per million (XPM) (F) or PAR-CLIP binding sites in the 3′ UTR (G) or CDS (H). (I) mRNAs were binned according to PAR-CLIP interactions. (Black) None; (blue line) only Pum2 sites; (green line) only Igf2bp3 sites; (orange line) only LIN28 sites; (red line) shared LIN28 and Igf2bp3 sites. The statistical significance of the shift compared with unbound targets was determined using a two-sided Kolmogorov-Smirnov (KS) test. Bin sizes are indicated.

