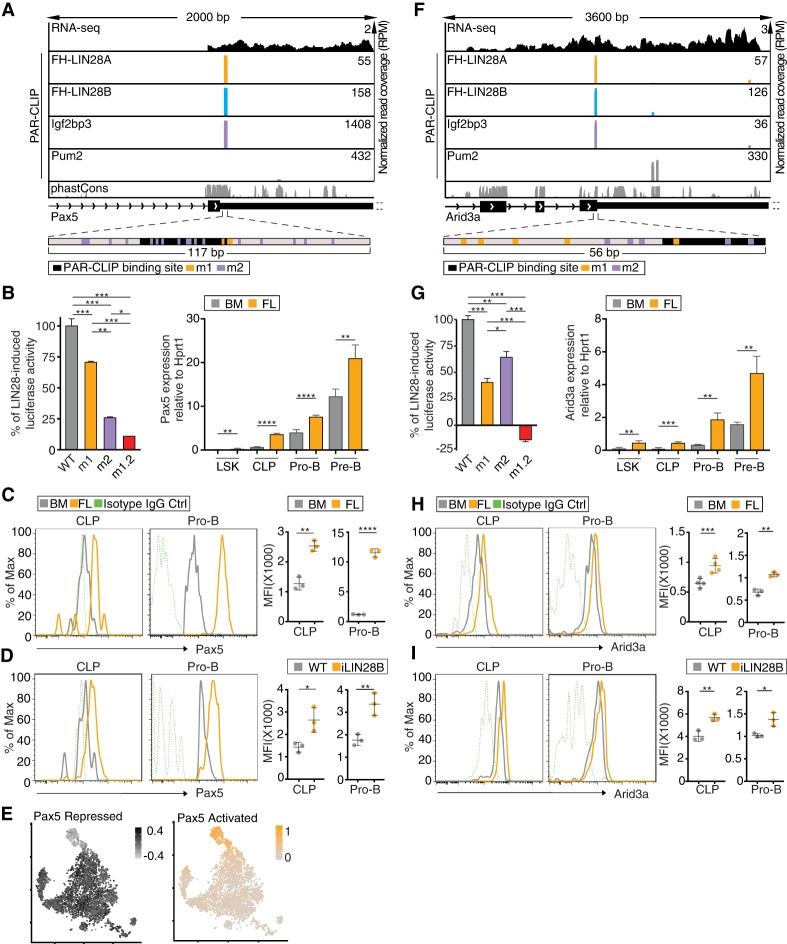
Figure 4.
Pax5 and Arid3a mRNAs are shared targets of LIN28 and Igf2pb3. (A,F) Genome browser tracks of binding sites in the Pax5 3′ UTR (A) and Arid3a CDS (F) are similar to Figure 3D. The browser windows are zoomed in on the primary shared binding site, and the 3′ UTRs of both transcripts extend further than depicted. The panels below the genome browser tracks depict the fragment of Pax5 3′ UTR or Arid3a CDS used in the dual-luciferase reporter constructs (shown in B,G). Locations of the binding site and mutations are shown by black (binding site), orange (m1), or purple (m2) bars. (B,G, left panel) Dual-luciferase reporter assays were performed using a sequence from a fragment of Pax5 3′ UTR (B) or Arid3a CDS (G) fused to Renilla luciferase (Rluc) and transfected into stable HEK293 cells inducibly expressing FH-LIN28A. WT indicates a fragment of the Pax5 3′ UTR or Arid3a CDS, m1 includes mutations in the LIN28 RRE, m2 includes mutations in the Igf2bp3 RRE, and m1.2 includes mutations in both. The Rluc signal was measured with or without FH-LIN28A transgene expression (±Dox) and was normalized to the signal from firefly luciferase (Fluc) encoded on the same reporter plasmid. The difference in normalized Rluc signal for WT with and without Dox was set to 100%, and the induced activity for m1, m2, and m1.2 was plotted relative to the WT baseline. Sequences are in Supplemental Table 10. (*) P ≤ 0.05; (**) P ≤ 0.01; (***) P ≤ 0.001, Tukey's HSD after adjustment for batch variation by two-way ANOVA. Bars represent mean ± standard error of mean (SEM) of three independent repeats. (Right panel) RT-qPCR analyses quantify Pax5 and Arid3a mRNA expression normalized to Hprt1 in LSK, CLP, pro-B, and pre-B cells sorted from FLs or BM. (**) P ≤ 0.01; (***) P ≤ 0.001; (****) P ≤ 0.0001, two-tailed t-test. Error bars represent standard deviation of three biological replicates. (C,H) Histograms depict Pax5 (C) and Arid3a (H) expression in CLP and pro-B cells from BM (gray) and FL (orange) based on FACS. Isotype IgG controls are also shown (green, dashed). The MFIs from biological replicates are plotted. (**) P ≤ 0.01; (***) P ≤ 0.001; (****) P ≤ 0.0001, two-tailed t-test. Error bars represent standard deviation of three to four biological replicates. (D,I) Histograms depict Pax5 (D) and Arid3a (I) expression in CLP and pro-B cells from BM of iLIN28B mice (orange) and WT littermate controls fed with Dox (gray). Isotype IgG controls are also shown (green, dashed). The MFIs from biological replicates are plotted. (*) P ≤ 0.05; (**) P ≤ 0.01, two-tailed t-test. Error bars represent standard deviation of three biological replicates. (E) tSNE plots show CLP cells colored by gene expression module scores of Pax5-activated targets (orange) and Pax5-repressed targets (black). Cells are colored according to scale, with darker-colored cells denoting higher aggregated expression of the respective sets of targets.

