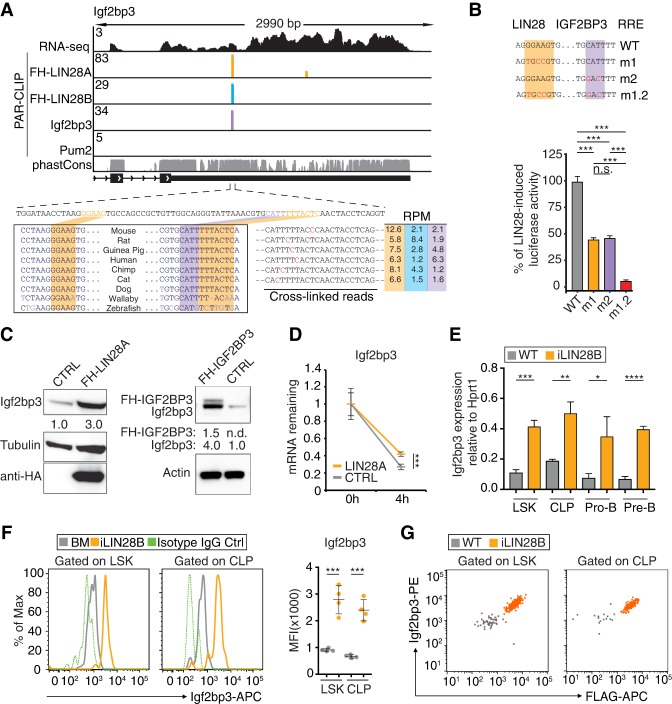
Figure 5.
Igf2bp3 and Lin28 proteins regulate Igf2bp3 expression in vitro and in vivo. (A) The genome browser tracks of the Igf2bp3 3′ UTR are formatted as in Figure 3D. (Bottom left panel) The alignment shows sequence conservation across the indicated vertebrates. The predicted LIN28 (orange) and Igf2bp3 (purple) RREs are highlighted. (Bottom right panel) Representative examples of common sequence reads from FH-LIN28A (orange), FH-LIN28B (cyan), and Igf2bp3 (purple) PAR-CLIP experiments are shown, with T-to-C mutations highlighted in red along with the sequence coverage in reads per million (RPM) color-coded by RBP. (B, top panel) Sequences of the WT RRE for the LIN28 ZnF domain and IGF2BP3 are shown. Mutations are indicated in red. (Bottom panel) Dual-luciferase reporter assay testing a fragment of the Igf2bp3 3′ UTR was performed as described in Figure 4C. (***) P ≤ 0.001, Tukey's HSD after adjustment for batch variation by two-way ANOVA. Bars represent mean ± SEM of three independent repeats. (C, left panel) Western blot of lysates from 220-8 cells transduced with empty vector (CTRL) or FH-LIN28A probed with anti-Igf2bp3, anti-Tubulin, and anti-HA antibodies. Quantitation of background-corrected intensities of the Igf2bp3 band normalized to tubulin is shown below the top panel. (Right panel) Western blo† of lysates from 220-8 cells transduced with empty vector (CTRL) or FH-IGF2BP3 probed with anti-Igf2bp3 and anti-Actin antibodies. Quantitation of background-corrected intensities of exogenous and endogenous Igf2bp3 bands normalized to actin is shown below the top panel. (D) RT-qPCR analyses quantify the fraction of Igf2bp3 mRNA remaining, normalized to U6 in 220-8 cell lines transduced with empty vector (CTRL) or untagged LIN28A after actinomycin D treatment for 4 h. (***) P ≤ 0.001, two-tailed t-test. Error bars represent standard deviation of three biological replicates. (E) RT-qPCR analyses quantify Igf2bp3 mRNA expression, normalized to Hprt1 in LSK, CLP, pro-B, and pre-B cells sorted from BM of iLIN28B mice and WT littermate controls fed with Dox. (*) P ≤ 0.05; (**) P ≤ 0.01; (***) P ≤ 0.001; (****) P ≤ 0.0001, two-tailed t-test. Error bars represent standard deviation of three biological replicates. (F) Histograms show Igf2bp3 expression in LSK and CLP cells from BM of iLIN28B mice (orange) and WT littermate controls fed with Dox (gray). Isotype IgG controls are also shown (green, dashed). The MFIs from biological replicates are plotted. (***) P ≤ 0.001, two-tailed t-test. Error bars represent standard deviation of four biological replicates. (G) The dot plots quantify transgenic Flag-LIN28B (X-axis) and endogenous Igf2bp3 (Y-axis) expression levels in LSK and CLP cells from BM of iLIN28B mice (orange) and WT littermate controls fed with Dox (gray). Results are representative of three biological replicates. Dots represent individual cells color-coded by sample.

