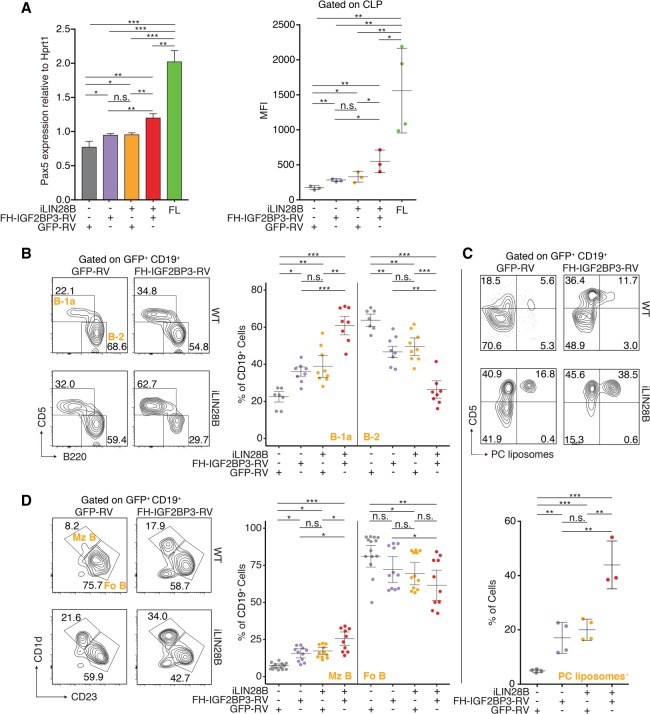
Figure 6.
LIN28B and IGF2BP3 cooperation in adult BM HSPCs enhances fetal-like B-cell development. (A) Adult BM HSPCs from WT and iLIN28B mice were transduced with empty vector (GFP-RV) or FH-IGF2BP3-RV and transplanted into Rag1−/− recipient mice. GFP+ CLPs were sorted from the recipient mice after 4 wk. (Left panel) RT-qPCR was used to quantify Pax5 mRNA expression. (Right panel) icFACS was used to quantify Pax5 protein levels. The Pax5 mRNA and protein levels in FL CLP are also shown as positive controls. (*) P ≤ 0.05; (**) P ≤ 0.01; (***) P ≤ 0.001, two-tailed t-test. Error bars represent standard deviation of three to four biological replicates. (B) Adult BM HSPCs from WT and iLIN28B mice were transduced with empty vector (GFP-RV) or FH-IGF2BP3-RV and transplanted into Rag1−/− recipient mice. (Left panel) The dot plots represent FACS analyses of B-1a and B-2 cells in the peritoneal cavity of BM chimeric mice 4–6 wk after transplantation gated on transduced B cells (GFP+ CD19+). (Right panel) Frequencies of B-1a and B-2 cells from three independent rounds of transplantation are plotted. (*) P ≤ 0.05; (**) P ≤ 0.01; (***) P ≤ 0.001, Tukey's HSD after adjustment for batch variation by two-way ANOVA. Error bars represent the mean ± SEM. (C, top panel) The dot plots represent FACS analyses of B-1a cells as described in A and quantify the percentage of cells that recognize PC. (Bottom panel) Frequencies of B-1a cells that recognize PC are plotted. (**) P ≤ 0.01; (***) P ≤ 0.001, two-tailed t-test. Error bars represent standard deviation of three to four biological replicates. (D, left panel) The dot plots represent FACS analyses of Mz B (B220+ CD1d+ CD23−ve) and follicular B-2 (Fo B; B220+ CD1d−ve CD23+) cells among transduced splenic B cells in BM chimeras. (Right panel) Frequencies of Mz B and follicular B-2 cells from three independent rounds of transplantation are plotted. (*) P ≤ 0.05; (**) P ≤ 0.01; (***) P ≤ 0.001, Tukey's HSD after adjustment for batch variation by two-way ANOVA. Error bars represent the mean ± SEM.

