Figure 1.
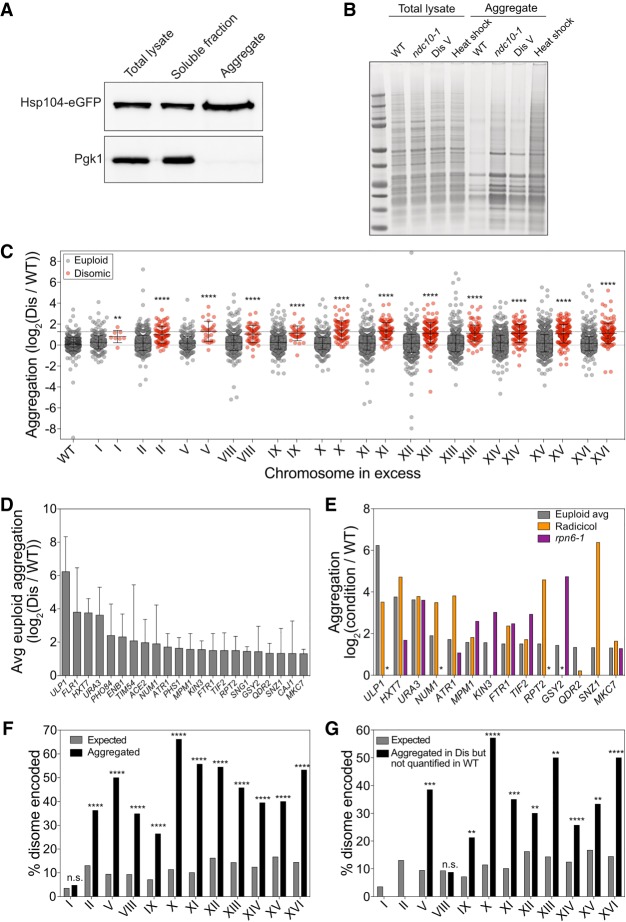
Identification of proteins that aggregate in aneuploid yeast cells. (A) Total lysate, aggregates, and soluble fractions obtained from exponentially growing cells expressing Hsp104-eGFP (A31392) were analyzed for Hsp104 and Pgk1 abundance. (B) Protein aggregates and total lysates were prepared from euploid cells (wild type [WT], A35797), ndc10-1 cells (ndc10-1, A13413) grown for 4 h at 30°C, disome V cells (disome [Dis] V, A28265), and euploid cells (A2587) after an 8-min heat shock at 42°C (heat shock). Total lysates and aggregate fractions were subjected to SDS-PAGE and stained with Coomassie. (C) WT and disome cells were grown to exponential phase in synthetic complete (SC) medium containing heavy lysine and light lysine, respectively. Aggregated proteins are separated into two dot plots, with red dots indicating proteins encoded on the duplicated chromosome and gray dots indicating proteins encoded on euploid chromosomes. The first column represents aggregates purified from a mixed sample of heavy lysine-labeled WT and light lysine-labeled WT. Lines represent mean and standard deviation (SD). The top dashed line at log2 1.27 shows the cutoff used to define aggregating proteins. (**) P < 0.01; (****) P < 0.0001, Mann-Whitney test. (D) The average (Avg) aggregate enrichment of proteins encoded on euploid chromosomes that were identified in aggregates of at least three out of 12 disomes. Only proteins with an average enrichment of ≥log2 1.27 as measured in C are shown. Error bars indicate SD. (E) The enrichment of proteins from D was compared with their enrichment in aggregates purified from cells treated with radicicol (orange) or cells harboring the rpn6-1 allele (purple) from Supplemental Figure S4. An asterisk indicates proteins that were not quantified in either the radicicol or rpn6-1 experiments because they did not pass the detection threshold in aggregates purified from the reference strain but were readily detected in aggregates isolated from radicicol-treated or rpn6-1 cells. (F) The percentage of proteins encoded by the duplicated chromosome that were enriched at a level greater than the aggregation threshold of log2 1.27 (black bars) and the percentage of proteins encoded by the duplicated chromosome as a fraction of the whole proteome (gray bars). (n.s.) Not significant; (****) P < 0.0001, cumulative distribution function for a hypergeometric distribution. (G) The percentage of proteins encoded by the duplicated chromosome that were not quantified by stable isotope labeling by amino acids in cell culture (SILAC) mass spectrometry (MS) because the heavy-labeled (WT) peptides did not pass the detection threshold (black bars) and the percentage of proteins encoded by the duplicated chromosome as a fraction of the whole proteome (gray bars). (n.s.) Not significant; (**) P < 0.01; (***) P < 0.001; (****) P < 0.0001, cumulative distribution function for a hypergeometric distribution.

