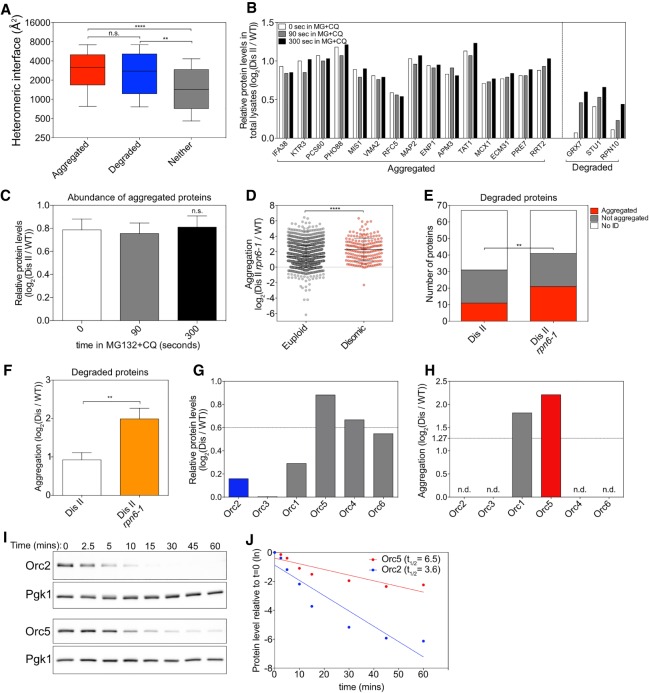
Figure 5.
Protein half-life determines whether a protein aggregates or is degraded. (A) Proteins encoded on duplicated chromosomes were separated into three categories: aggregated, degraded, and neither. Aggregated proteins (red) and degraded proteins (blue) were defined as in Figure 4A. Proteins that were identified in our analysis and that by Dephoure et al. (2014) but did not pass the threshold for aggregation or degradation were considered neither aggregated nor degraded (gray). The heteromeric interface sizes of the proteins in each category are plotted as box plots, with whiskers representing the 10th–90th percentile. (****) P < 0.0001; (**) P < 0.01; (n.s.) not significant, Mann-Whitney test. (B) The change in levels of proteins encoded on chromosome II in disome II in total lysates of cells treated with 100 µM MG-132 (MG) and 10 mM chloroquine (CQ) relative to WT (data from Dephoure et al. 2014). Examples of aggregating proteins as determined in Figure 1C and of degraded proteins as determined by Dephoure et al. (2014) are shown. White bars indicate relative levels immediately before the addition of MG-132 and chloroquine, and gray bars and black bars indicate relative levels 90 and 300 sec thereafter, respectively. (C) Mean levels of all aggregating proteins as measured in B at each time point. Error bars indicate SEM. (n.s.) Not significant, Wilcoxon matched-pairs signed rank test. (D) Disome II rpn6-1 (A40196) or WT (A23504) cells were grown to exponential phase at 30°C in SC medium containing light lysine and heavy lysine, respectively, and aggregating proteins were identified. Lines indicate mean and SD. (****) P < 0.0001, Mann-Whitney test. (E) Proteins considered degraded when duplicated by Dephoure et al. (2014) were examined in aggregates purified from disome II cells (shown in Fig. 1C) and disome II rpn6-1 cells (shown in D). A protein was considered to aggregate when it was enriched by more than log2 1.27 in aggregates (red) and not aggregated when enriched by less than log2 1.27 (gray). “No ID” indicates proteins that were not identified in aggregates (white). (**) P < 0.01, cumulative distribution function for a binomial distribution. (F) Degree of aggregation was determined for all proteins in E in disome II aggregates and disome II rpn6-1 aggregates. Bars represent SD. (**) P < 0.01, Mann-Whitney test. (G,H) Relative protein levels as determined by Dephoure et al. (2014) (G) and relative aggregation as measured in Figure 1C (H) for origin recognition complex (ORC) subunits when encoded by disomic chromosomes. (n.d.) Not detected in aggregates. (I,J) Cells were grown to exponential phase at 30°C in YEP medium containing 2% raffinose. Expression of HA-tagged ORC2 (A40197) and ORC5 (A40198) was induced with 2% galactose for 20 min. Next, protein synthesis was halted by the addition of 2% glucose and 0.5 mg/mL cycloheximide (t = 0). Protein levels were determined. Pgk1 was used as a loading control (I). Protein levels were quantified relative to the loading control and normalized to the 0-min time point (J). (Dis) Disome; (ln) natural logarithm.

