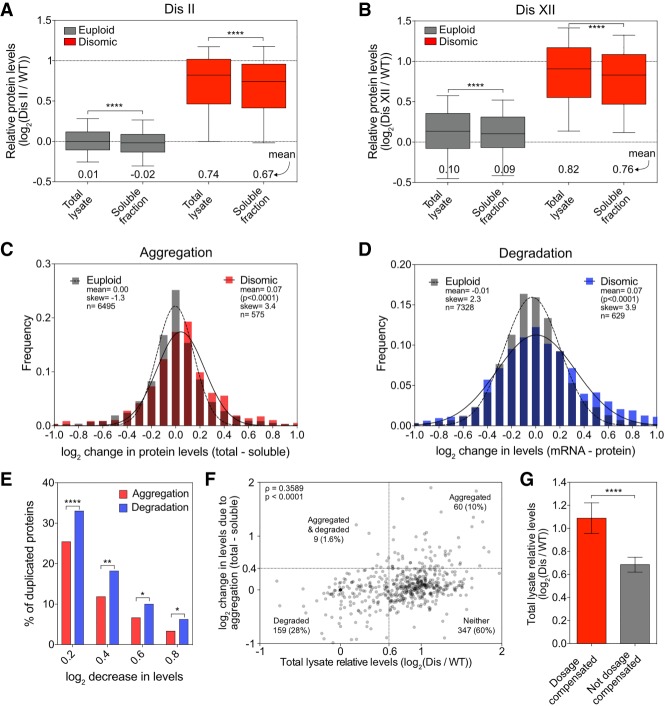
Figure 6.
Dosage compensation by protein aggregation. (A,B) Total lysate and soluble fractions, obtained as described in Figure 1A, were analyzed for disome II (A) and disome XII (B). Proteins encoded by euploid chromosomes (gray) and proteins encoded by the duplicated chromosome (red). Data are represented as box plots, with whiskers extending to 10th and 90th percentiles. Means are indicated below. The top dashed line represents the theoretical mean for proteins encoded by the duplicated chromosome. (****) P < 0.0001, Mann-Whitney test. (C) Changes in protein levels due to aggregation for proteins quantified in A and B were calculated for every protein by subtracting its log2 ratio in the soluble fraction from its log2 ratio in the total lysate. Disome II and disome XII data were pooled and separated into two subsets: euploid chromosome-encoded proteins (gray) and disomic chromosome-encoded proteins (red). Frequency distributions of each subset were then generated using a bin size of 0.1. Distributions were fit to Gaussian curves for euploid (dashed line) and disome (solid line). P-value shows that mean change of disome-encoded proteins is significantly different from the mean change of euploid-encoded proteins (Mann-Whitney test). (D) Changes in protein levels due to degradation for disome II and disome XII were calculated by subtracting the relative protein level from the relative mRNA level for each gene as measured by Dephoure et al. (2014). Frequency distributions were generated, and curve fitting was performed on the pooled data as in C. P-value shows that mean change of disome-encoded proteins is significantly different from the mean change of euploid-encoded proteins (Mann-Whitney test). (E) The percentage of proteins encoded by the duplicated chromosome that decreased in levels by at least a log2 of 0.2, 0.4, 0.6, and 0.8 due to aggregation (red bars) was calculated using the data described in C, and the percentage of those that decreased due to degradation (blue bars) was calculated using the data in D. (****) P < 0.0001; (**) P < 0.01; (*) P < 0.05, χ2 test. (F) The correlation between protein levels in total lysate and reduction in levels due to aggregation was determined for proteins encoded on duplicated chromosomes from the pooled data set of disome II (A) and disome XII (B). Spearman correlation of 0.3589 (P < 0.0001). Dashed lines indicate thresholds for proteins being considered dosage-compensated by aggregation (Y-axes) or degradation (X-axes). The number of proteins that fall into each quadrant is indicated (note that 19 data points fell outside the range of the axes but were included in the calculations). (G) Proteins encoded on duplicated chromosomes were separated into two categories: Dosage-compensated proteins (red) were defined as their levels being reduced by at least log2 0.4 in the soluble fraction relative to the total lysate. “Not dosage-compensated” proteins (gray) were defined as their levels being reduced by less than log2 0.4. Mean levels in total lysates are plotted; error bars indicate 95% confidence intervals. (****) P < 0.0001, Mann-Whitney test. (Dis) Disome.

