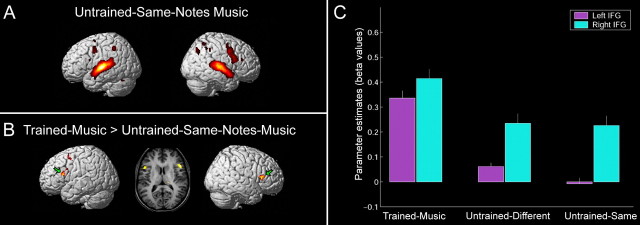
Figure 4.
A,Areas activated during listening to the untrained-same-notes-music contrasted against rest (p < 0.05, FDR corrected). B, Contrasted image of group mean activation is presented in areas that were significantly more active during listening to trained-music compared with untrained-same-notes-music. This included the left premotor region as well as Broca's area and its right hemispheric homolog (green arrows), shown also in the corresponding coronal view (middle) (p < 0.05, FDR corrected). C, Parameter estimates (β values) of the left (−50, 18, 16; magenta) and right (52, 18, 16; cyan) IFG across listening conditions. Results indicate significant pick activations on the left IFG only when subjects listen to the trained-music they knew how to play (p = 0.001), whereas the right IFG remained fairly active across listening conditions (p = 0.973).

