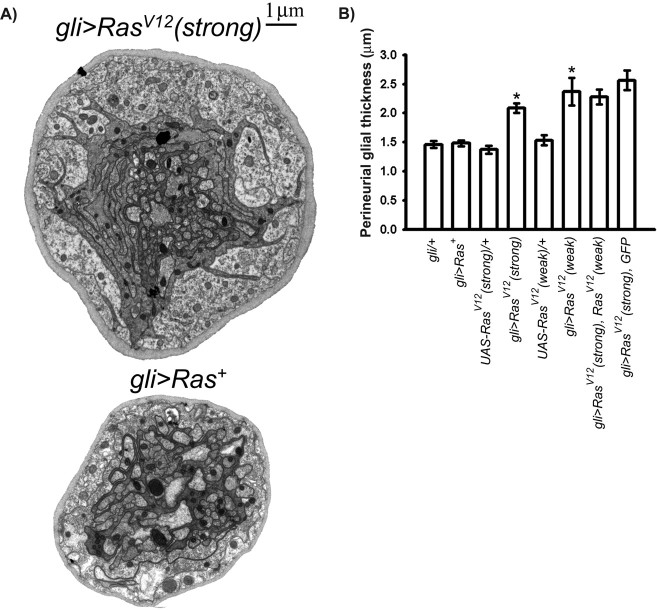
Figure 2.
Expression of activated Ras in peripheral glia increases perineurial glial growth. A, TEMs of cross sections from representative peripheral nerves of the indicated genotypes. The gli>Ras+ nerve is the same nerve cross section shown Figure 1A. B, Perineurial glial thickness (y-axis) from the indicated genotypes (x-axis). Means ± SEMs are indicated. One-way ANOVA and Scheffé's tests for multiple comparisons showed the following statistically significant differences, denoted by asterisks: gli>RasV12(strong) (2.08 ± 0.082 μm; n = 78), gli>RasV12(weak) (2.37 ± 0.236 μm; n = 20), gli>RasV12(strong), RasV12(weak) (2.28 ± 0.130 μm; n = 56), and gli>RasV12(strong), GFP (2.57 ± 0.17 μm; n = 43) versus gli>Ras+ (1.48 ± 0.048 μm; n = 99), gli–Gal4/+ (1.46 ± 0.057 μm; n = 60), UAS–RasV12(strong)/+ (1.37 ± 0.068 μm; n = 45), and UAS-RasV12(weak)/+ (1.53 ± 0.088 μm; n = 22). For all such tests, p < 0.0001.

