
Figure 2.
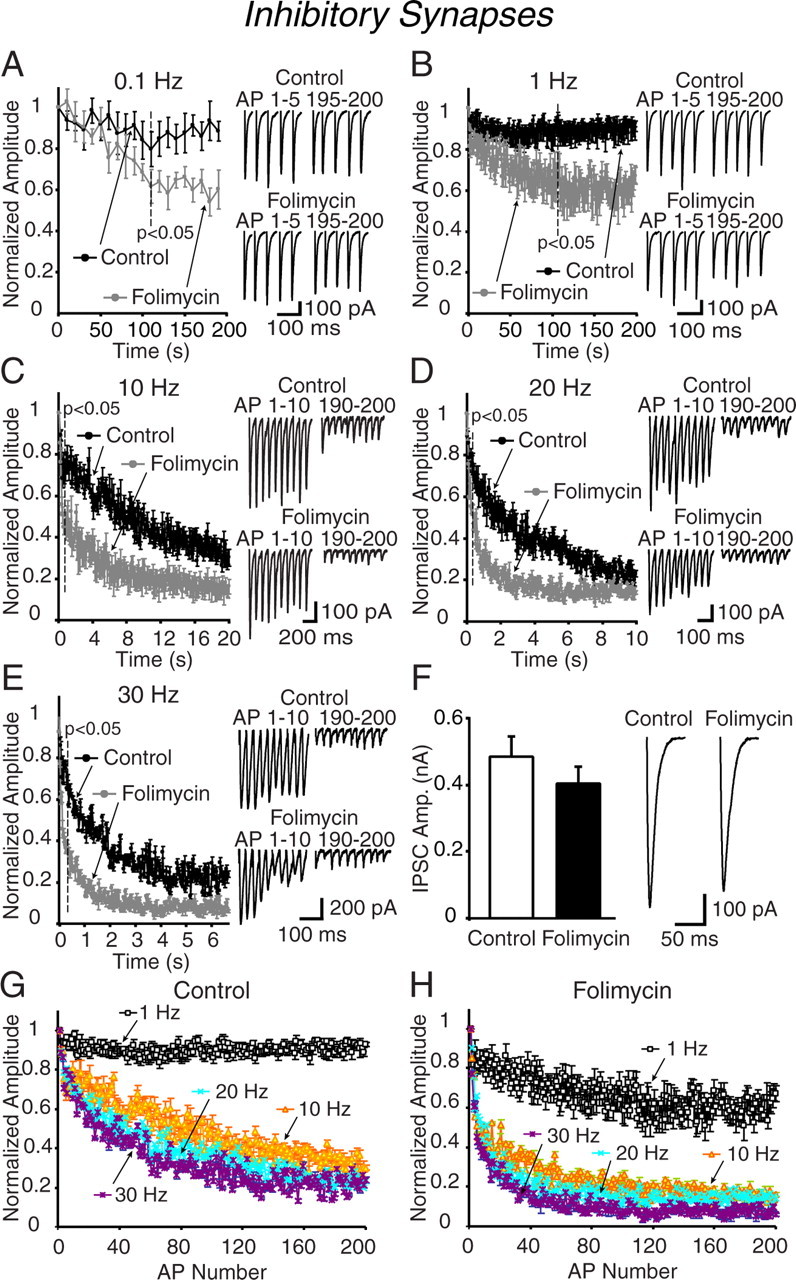
Inhibitory synapses in acute hippocampal slices show rapid depression after folimycin treatment. A–E, CA1 pyramidal neurons in hippocampal slices were treated with folimycin or vehicle controls for 10 min and subsequently synaptic depression was evaluated in the presence of CNQX (10 μm) and AP-5 (50 μm) to block excitatory currents, at 0.1 (A), 1 (B), 10 (C), 20 (D), and 30 Hz (E) (n = 5–8 for each protocol). Similar to excitatory synapses, folimycin blocked the vesicular refilling in a frequency-dependent manner. Trains of higher-frequency stimulation caused a more rapid decline of vesicles and faster depression rate in folimycin-exposed synapses when compared with controls (p < 0.05). Insets are sample traces from the first and last 5 AP-evoked IPSCs at 0.1 (A) and 1 Hz (B) and from the first and last 10 evoked IPSCs at 10 (C), 20 (D), and 30 Hz (E) electrical stimulation. F, Sample traces of initial evoked IPSCs recorded from control and folimycin-treated cells. After folimycin treatment, the first evoked response in inhibitory synapses was slightly reduced, although this reduction did not reach to statistical significance. Data shown are mean ± SEM. G, H, Alteration in synaptic depression >1 Hz is regardless of the number of action potentials applied at folimycin treated (H) and untreated (G) inhibitory synapses. Plots were prepared from the data presented in A–E. At 0.1 and 1 Hz, time constants of synaptic depression were 576.0 ± 15.9 and 222.0 ± 24.6 s, respectively. The time constants at 0.1 and 1 Hz were similar at folimycin-treated synapses (503.8 ± 19.4 and 212.0 ± 54.1 s respectively; p > 0.50; n = 5–7 cells). At higher frequencies, time constants from folimycin-treated synapses were lower when compared with controls (at 10, 20, and 30 Hz: 2.86 ± 0.8, 1.12 ± 0.1, and 0.70 ± 0.1 s respectively for controls, and 0.90 ± 0.1, 0.70 ± 0.1, and 0.30 ± 0.1 s for folimycin-treated; p < 0.05 for each frequency; n = 5–8 cells for each group).