
Figure 8.
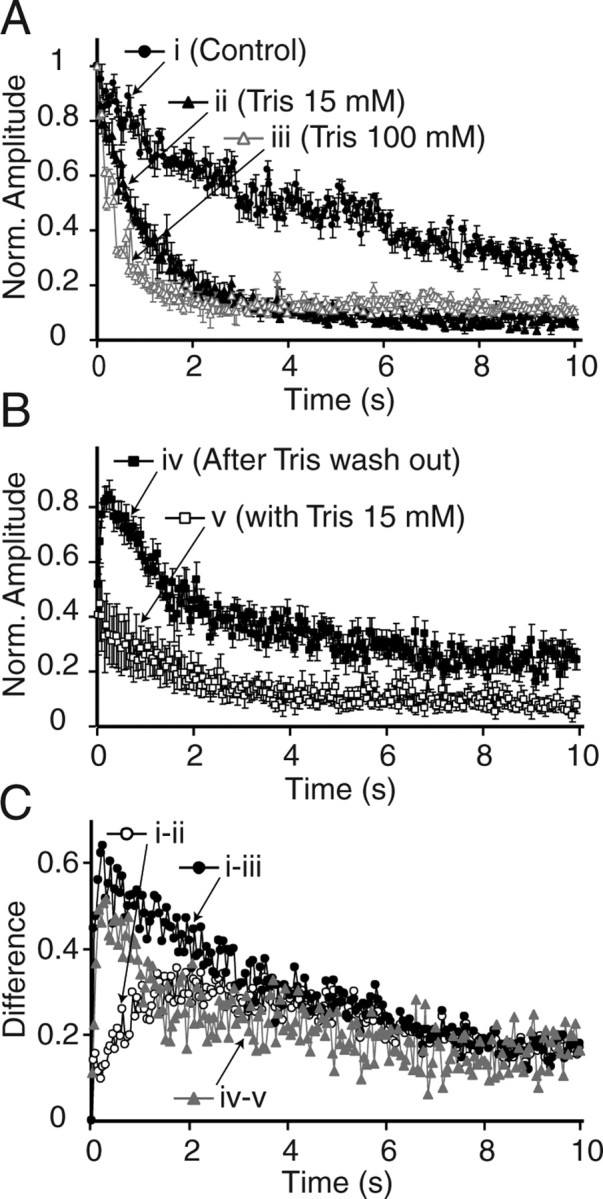
The kinetics of use-dependent recovery from depression matches the difference between synaptic depression kinetics recorded under control and Tris-treated conditions. A, Plots showing 20 Hz- (200 pulses) induced synaptic depression in control, 15 mm Tris-, and 100 mm Tris-treated slices. B, Plots showing the recovery after 20 Hz, 200 pulse trains in the presence or absence of Tris. C, Plots showing three curves depicting the difference in synaptic depression kinetics between control and 15 mm Tris (i-ii), control, and 100 mm Tris (i-iii), and 20 Hz-induced response recovery with and without Tris wash out (iv-v). Note the match between curves i-iii and iv-v. This analysis is performed on the data presented in Figures 6 and 7.