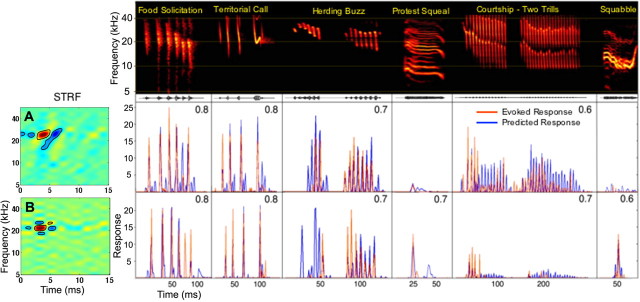
Figure 3.
STRFs provide accurate predictions of responses to species-specific calls. Spectrograms of each species-specific vocalization are shown in the top, with the evoked response of each IC neuron (red) and the predicted response of its STRF (blue) displayed below each call. Each row shows the predicted and evoked responses of an IC neuron with its STRF on the left. Predicted responses were generated by convolving the STRF of the neuron with the spectrogram of each call. Correlation between predicted and actual response is shown in top right of each panel. A, B, Two neurons in which there were high correlations between their STRF predictions and their actual responses. Convolutions predicted the call selectivity of these neurons because they predicted very low response magnitudes for the calls that evoked little or virtually no responses but predicted high response magnitudes for those calls that evoked strong responses. Those calls that evoked little or no responses were used to demonstrate that convolving STRFs with those calls also predicted little or no activity, but no correlation coefficient was computed for those calls.

