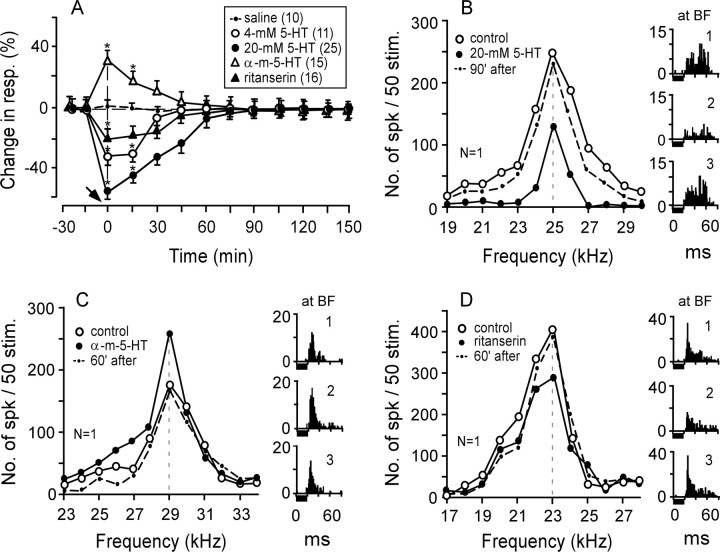
Figure 2.
Changes in response magnitude evoked by 5-HT, α-methyl-5-HT, or ritanserin. A, The change (mean ± SE) in response (number of spikes per 50 tone bursts) is expressed in percentage of spikes per 50 tone bursts compared with the response in the control condition (*p < 0.01). The arrow along the time axis indicates when a drug was applied to the AI. The inset shows the symbols indicating the drugs applied to the AI and the number of single neurons affected by a drug. α-m-5-HT, α-Methyl-5-HT. B–D, The frequency-response curves and poststimulus-time histograms (1–3) displaying the responses at the BFs of three single neurons were recorded before (control), 5 min after, and 60 or 90 min after a drug application. Each horizontal bar under the histogram represents a 20 ms tone burst fixed at 10 dB above the MT of a given neuron. N, Number of neurons studied; resp., response; stim., stimulation; No., number; spk, spike.

