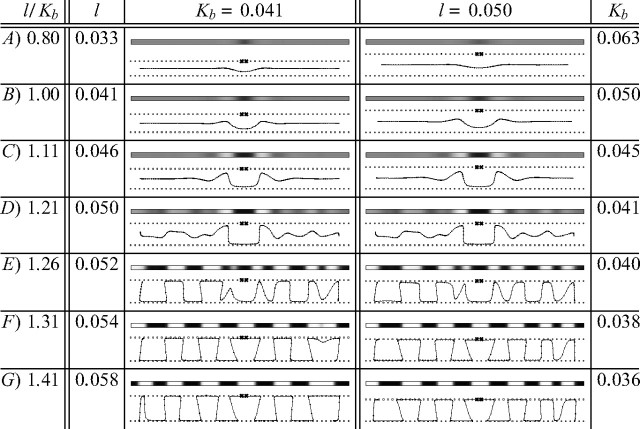
Figure 3.
Different degrees of angioscotoma representation similar to those observed experimentally are produced in one-dimensional cortices using the elastic net algorithm of visual cortical development by altering the ratio l/Kb. For the simulations in the left column, birth time Kb was constant, while l varied. In the right column, l was constant, while Kb was varied. A larger l value corresponds to faster OD column development, whereas a smaller Kb value corresponds to later birth (and hence angioscotoma introduction) when column formation is more advanced. All other parameters were the same in each case. For all simulations, annealing continued at the same rate for 10 iterations after angioscotoma introduction. The grayscale pictures show how OD changes as the cortex is traversed: black represents afferents from the bottom retina, and white represents afferents from the top (where top and bottom correspond arbitrarily to the right and left eye biologically). Note the frosting clearly apparent in B–D. The line drawings show the one-dimensional elastic rope of cortical points and the two rows of retinal points spanning a one-dimensional visual field. The horizontal position of cortical points indicates the position they represent in one-dimensional visual space, and the vertical position indicates ocularity (as in Goodhill and Willshaw, 1990). The crosses mark the position of the blood vessel after birth.

