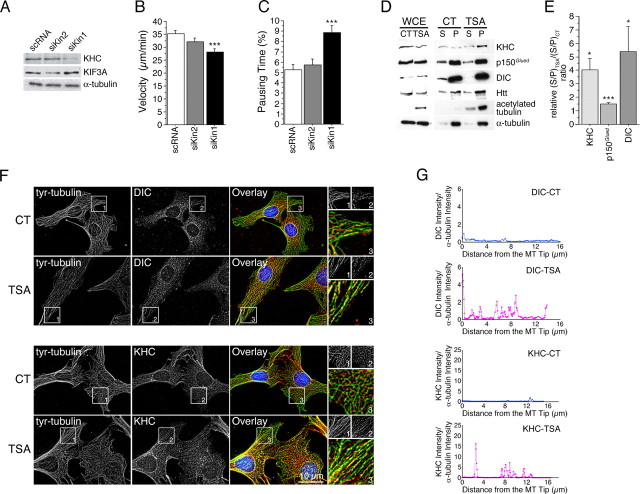
Figure 4.
Inhibition of tubulin deacetylation increases the recruitment of motor complex proteins on MTs. A–C, WT (+/+) cells were transfected with BDNF-eGFP and siRNA directed against scramble RNA (scRNA), kinesin 2 (siKin2), or kinesin 1 (siKin1) 1 d before BDNF-eGFP transfection. A, Total extracts were analyzed by Western blot for kinesin-1 (KHC), kinesin-2 (KIF3A), and α-tubulin. B, C, Cells were analyzed by videomicroscopy. Dynamics were quantified by the use of the mean velocity of vesicles per cell (B) and their pausing time (C). D, MT polymerization experiments were performed from WT cells treated for 4 h with DMSO (0.5%, control, CT) or TSA (5 μm), and analyzed for the presence of kinesin (KHC), dynactin (p150Glued), dynein (DIC), htt, acetylated tubulin, and α-tubulin in S and P fractions using whole-cell extract (WCE). E, Quantitative assessment of the optical density of kinesin (KHC), dynactin (p150Glued), dynein (DIC) expressed as (S/MT P)TSA/(S/MT P)CT ratios. Results were normalized to 1. *p < 0.05; ***p < 0.001. F, WT (+/+) cells were treated for 4 h with DMSO (0.1%, CT) or TSA (1 μm), fixed, and stained for tyrosinated tubulin (green) and dynein (DIC; red) or kinesin (KHC; red). Insets correspond, respectively, to a 1.5× and 3× enlargement of the black and white and color images. G, Representative linescan analyses of the distributions of dynein (DIC) and kinesin (KHC) from the MT tips in CT (blue) and after TSA (1 μm; red) treatment.

