
Figure 1.
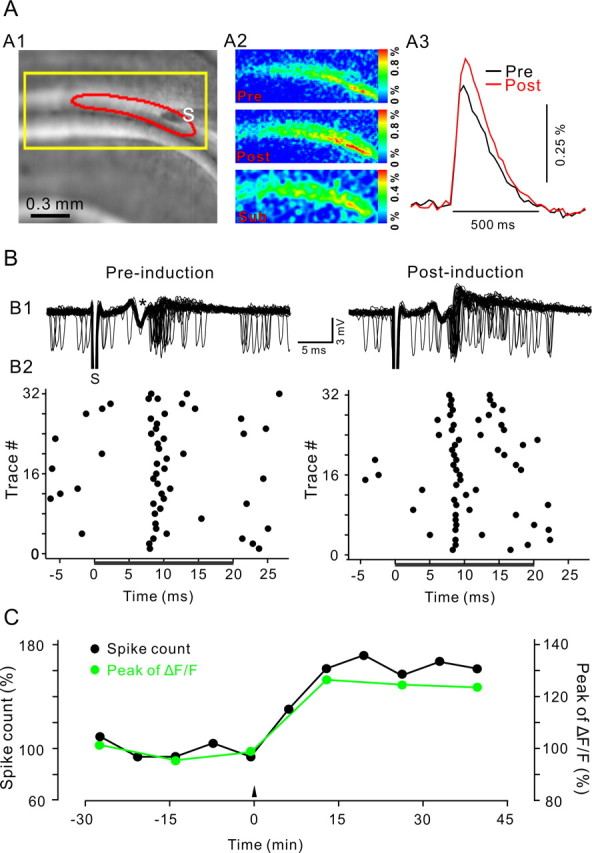
LTP of PF presynaptic Ca2+ transients and PF-to-PN synaptic transmission induced by 4 Hz PF stimulation. A, LTP induction induced a long-term augmentation of PF Ca2+ transients. A1, Fluorescent image of a coronal cerebellar slice from a GCaMP2 transgenic mouse with a stimulation electrode (S) placed in the molecular layer. The yellow rectangle indicates the cropped region used in A2. A2, Color-coded map of peak Ca2+ transients in response to a single PF stimulation pulse, before (Pre) and after (Post) LTP induction. The bottom map (Sub) shows the difference between the preinduction and postinduction maps of the Ca2+ transient. A3, Time course of ΔF/F values obtained from the responsive area (boxed area in A1). B, Extracellularly recorded spiking activity of a PN recorded simultaneously with the Ca2+ imaging shown in A. B1, Superposition of 32 representative recording epochs of spiking activity before (left) and 45 min after (right) 4 Hz stimulation. The time of a single PF stimulus is indicated by stimulus artifact (S); PF action potential volley is indicated by an asterisk. B2, Raster plot of spike events derived from traces shown in B1. Spikes were counted in the interval between 0 and 20 ms after PF stimulation (black bar) to derive the spike count measure plotted in C. C, Time course of the normalized spike count during the first 20 ms after PF stimulation (black) and peak of Ca2+ transients (green). Individual Ca2+ transients and spike count measurements are averages of 32 sweeps recorded at 0.04 Hz. All data are from the same experiment.