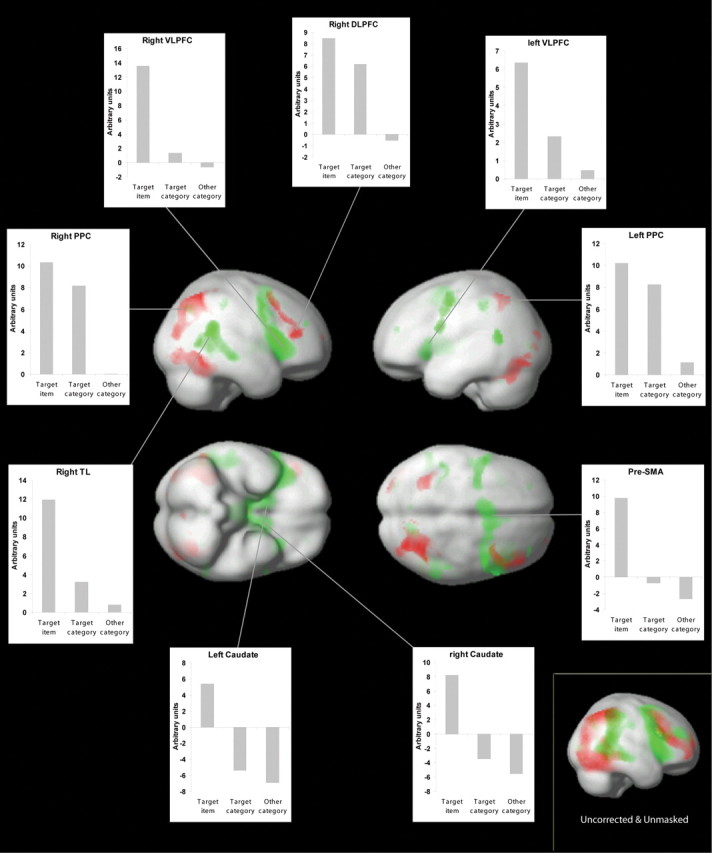
Figure 2.

Relevance-sensitive brain areas. Results from the whole-brain analysis are shown. Green indicates brain regions that are tightly tuned to the target item; red indicates regions that are more widely tuned to the category level (see Introduction for definitions). The inset graphs display average activation levels extracted for the whole-activation clusters. Inset, Targets minus same-category nontargets and same-category nontargets minus nontargets from other categories, both contrasts at p < 0.05 uncorrected and unmasked. Little overlap (yellow) is observed between the two activation patterns even at this low threshold. TL, Temporal lobe; SMA, supplementary motor area.
