
Figure 2.
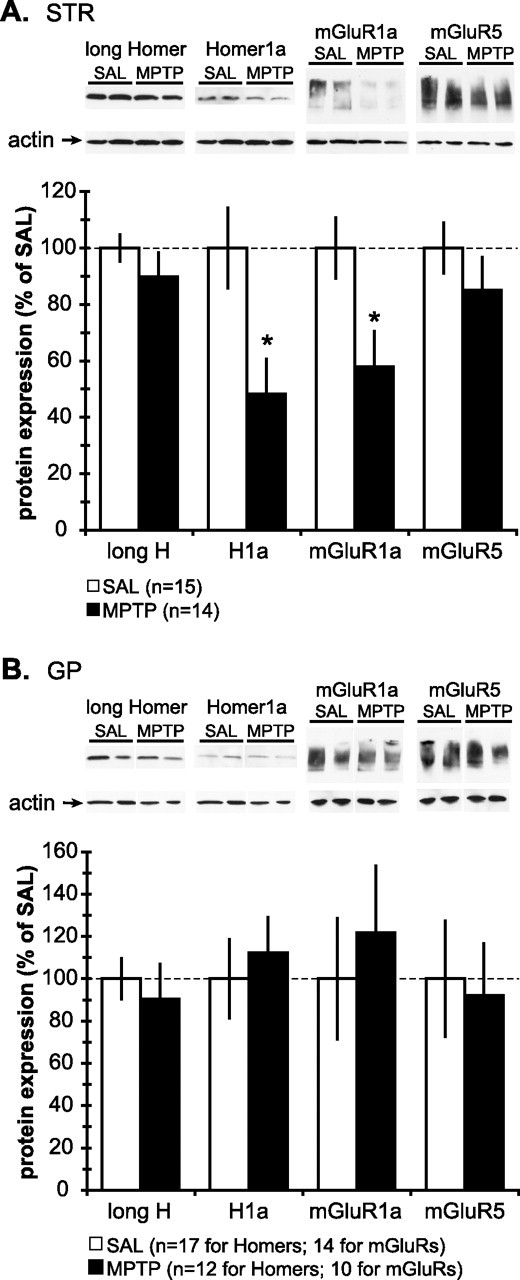
Western immunoblot analysis of the total tissue expression levels of group I mGluRs and Homer proteins in the STR and GP of saline- and MPTP-treated mice. A, Top, Representative immunoblots of the striatal tissue samples from two SAL-treated and two MPTP-treated mice, probed for (from left) long Homer, H1a, mGluR1a, and mGluR5. The molecular weights of long Homer and H1a were ∼45 kDa and ∼27 kDa, respectively. Both mGluR1a and mGluR5 migrated as monomers and multimers with the molecular weight ranging from ∼130 to ∼250 kDa. Actin was used as loading control and was unaffected by MPTP treatment. Note that the intensity of immunoreactive bands for H1a and mGluR1a in the MPTP mice is less than the saline-treated mice. Bottom, Quantification of the intensity of immunoreactive bands from the striatal samples from SAL- (n = 15) and MPTP-treated (n = 14) mice. All values are normalized to the saline-treated group and expressed as mean ± SEM. Note that MPTP treatment causes ∼50% and ∼40% reduction in H1a and mGluR1a levels, respectively (*p < 0.05; t test). B, Top, Representative immunoblots of GP tissue samples from two SAL-treated and two MPTP-treated mice, probed for (from left) long Homer, H1a, mGluR1a, and mGluR5. Note that the intensity of immunoreactive bands for Homer proteins and group I mGluRs is not altered by MPTP treatment. Bottom, Quantification of the intensity of immunoreactive bands from the striatal samples from SAL- (n = 15) and MPTP-treated (n = 14) mice reveals that MPTP treatment had no effect on the expression levels of Homer proteins and group I mGluRs in GP. All values are normalized to the saline-treated group and expressed as mean ± SEM.