Figure 4.
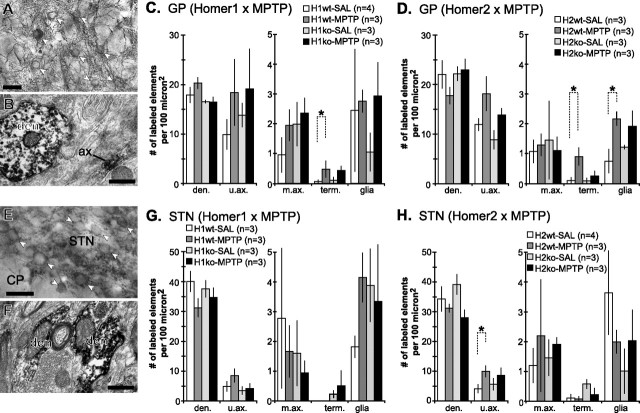
LM and EM immunoperoxidase localization of mGluR1a in GP and STN of wild-type and Homer-deficient mice treated with MPTP or saline. A, Immunoperoxidase labeling for mGluR1a in GP at light microscopic level shows densely stained neuropil and perikarya (white arrowheads). B, Immunoreactivity for mGluR1a is mainly expressed in dendrites and unmyelinated axons. Note that mGluR1a labeling in a longitudinally cut unmyelinated axon (ax) appears as a discrete patch of peroxidase reaction product along the length of the axon. C, D, Histograms summarizing the subcellular localization of mGluR1a in GP neuropil of Homer1 (C) and Homer2 (D) mice, expressed as the mean ± SEM density of labeled elements per 100 μm2 of GP tissue. Note that statistically significant differences were found in the density of mGluR1a-immunopositive axon terminals (C, D, term.; *p < 0.05; Tukey test) and that of mGluR1a-labeled glial processes (D, glia; *p < 0.05; Tukey test). E, Immunoperoxidase labeling for mGluR1a in STN at light microscopic level shows densely stained neuropil and perikarya (white arrowheads). F, Immunoreactivity for mGluR1a is mainly expressed in dendrites, with occasional labeling in unmyelinated axons. G, H, Histograms summarizing the subcellular localization of mGluR1a in STN neuropil of Homer1 (G) and Homer2 (H) mice, expressed as the mean ± SEM density of labeled elements per 100 μm2 of STN tissue. Note that statistically significant differences were found in the density of mGluR1a-immunopositive unmyelinated axons (H, u.ax.; *p < 0.05; Tukey test). CP, Cerebral peduncle; den, dendrites; u.ax., unmyelinated axons; m.ax., myelinated axons; term., terminal boutons; glia, glial processes. Scale bars: A, E, 50 μm; B, F, 0.5 μm.

