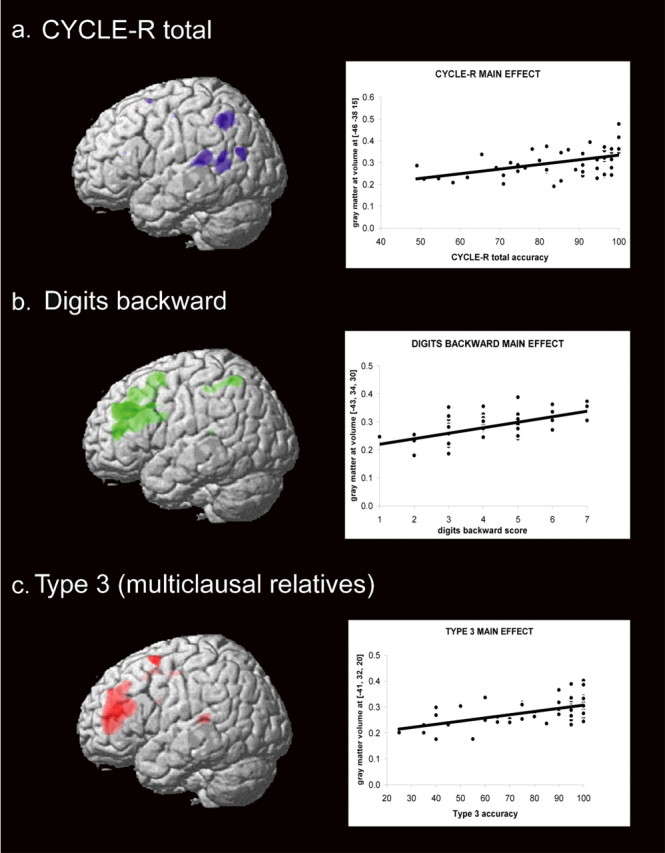
Figure 1.

a, Main effects of total CYCLE-R accuracy (blue). b, DB (green) scores. c, Type 3 sentences (multiclausal relatives; red). The plots show the relationship between gray matter volumes in arbitrary units (y-axis) and the task scores in the x-axis for each analysis; in particular, the gray matter volumes represent the highest peak of each contrast. Results are superimposed on the three-dimensional rendering of the Montreal Neurological Institute standard brain and displayed at a threshold of p < 0.001, uncorrected.
