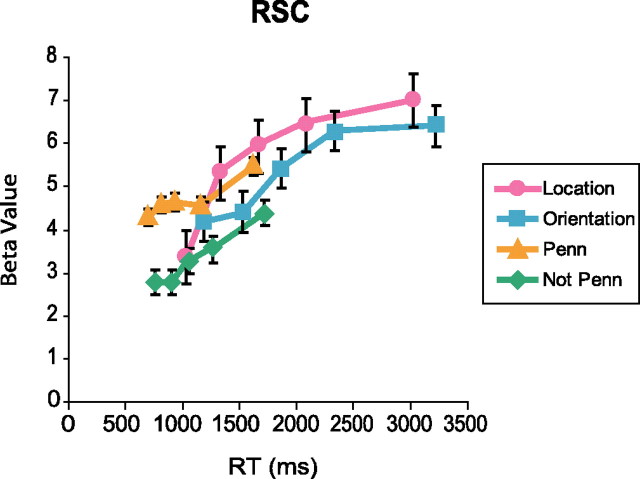
Figure 3.
RSC response as a function of RT. Trials are divided into quintiles based on RT, and the fMRI response for each quintile and condition is plotted. There is a clear increase in fMRI response with longer RTs. However, the differences between the location versus orientation and Penn versus not Penn conditions appear to be consistent across RT. Error bars are ± 1 SEM.

