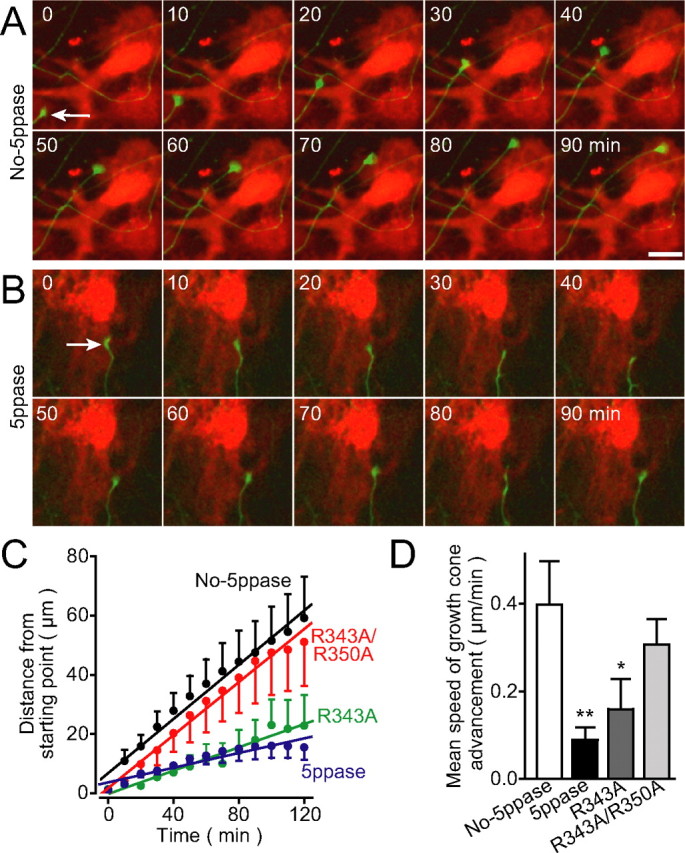
Figure 4.

Suppression of growth cone advancement on Ca2+ signal-deficient astrocytes. A, B, Time-lapse images of growth cones (arrows) of GFP-expressing neurons (green) on astrocytes (red) transduced with No-5ppase (A) or wild-type 5ppase (B). Scale bar, 20 μm. See supplemental Movies 1 and 2 (available at www.jneurosci.org as supplemental material). C, D, Summarized time courses (C) and mean speed of growth cone advancement (D) in each group of astrocytes (No-5ppase, 5ppase, R343A, and R343A/R350A; mean ± SEM; n = 17–18). *p < 0.05 and **p < 0.01, compared with No-5ppase using one-way ANOVA with Tukey's post hoc test. Neurons at 10–18 d in vitro were imaged.
