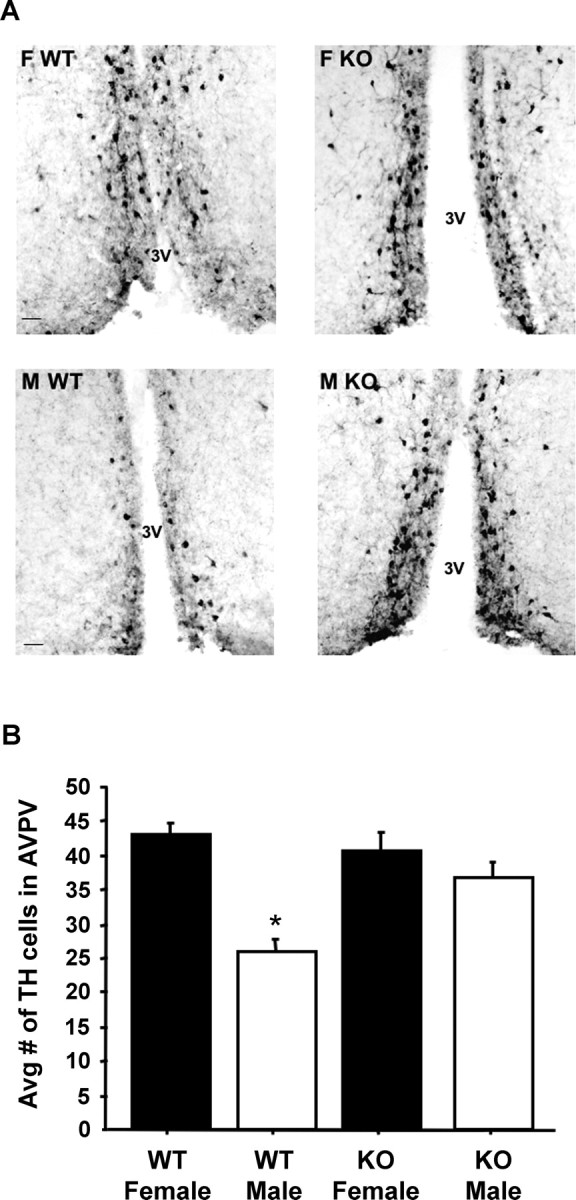
Figure 4.

A, Representative photomicrographs of TH neurons in the AVPV nucleus of testosterone-treated WT and GPR54 KO mice of both sexes. F, Female; M, male; 3V, third ventricle. Scale bar, 50 μm. B, Mean (±SEM) number of TH neurons in the AVPV nucleus of testosterone-treated WT and GPR54 KO male and female mice. *p < 0.05, significantly different from all other groups.
