
Figure 8.
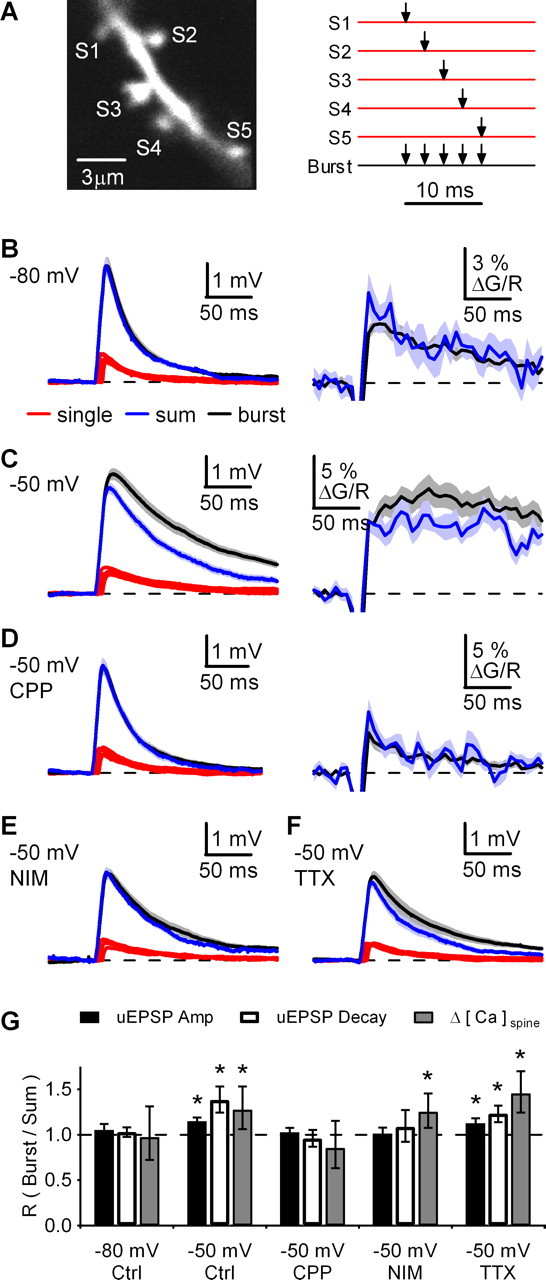
Bursts of inputs at spine clusters trigger supralinear responses. A, Left, 2PLSM image of dendrite and cluster of five spines (S1–S5). Right, Schematic showing 2PLU at each spine alone (red traces) or burst stimulation at all spines (black trace). B, Left, uEPSPs at −80 mV with an ISI of 2 ms, showing single-spine responses (red traces), the linearly predicted sum of these responses (blue trace), and burst response (black trace). Right, ΔG/Rspine measured in one of the five spines, showing the linearly predicted sum of single spine responses (blue trace) and burst response (black trace). C–F, As in B for uEPSPs and ΔG/Rspine at −50 mV (C), uEPSPs and ΔG/Rspine at −50 mV in CPP (D), uEPSPs at −50 mV in nimodipine (E), and uEPSPs at −50 mV in TTX (F). G, Ratio (R) of burst and sum for uEPSP amplitudes, uEPSP half-decay times and Δ[Ca]spine amplitudes in the indicated conditions. Summary data are shown as the geometric mean and 95% confidence interval. *p < 0.05 compared with unity.