
Figure 6.
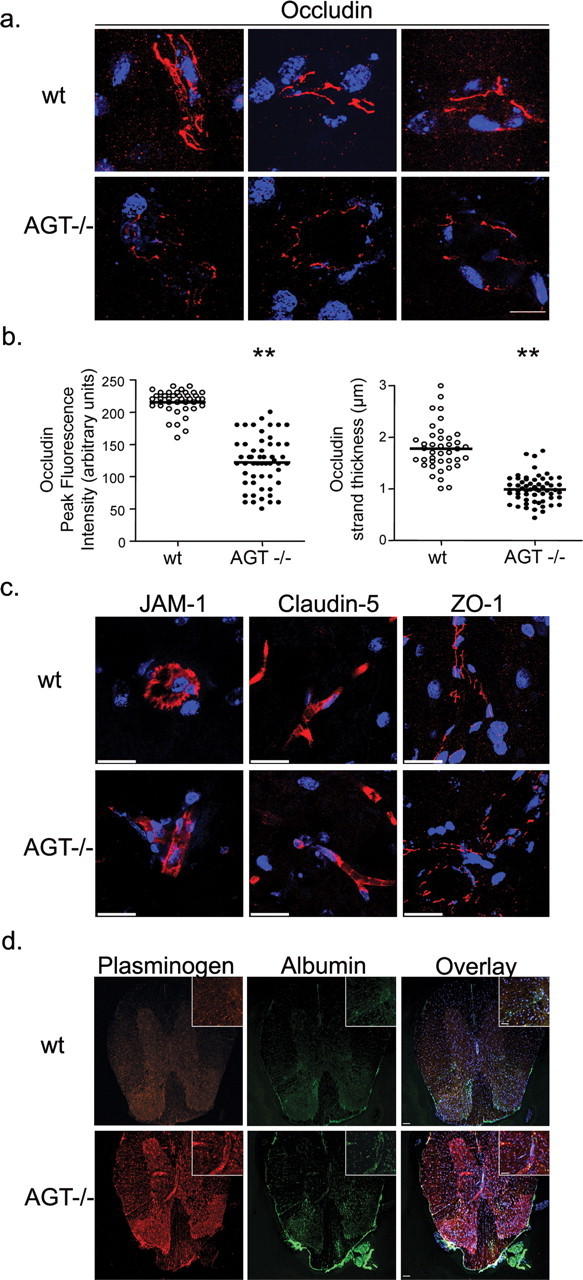
Tight junction protein expression and BBB dysfunction in the CNS of angiotensinogen null animals. a, x-y-z projection of occludin staining in the brain capillary of wt and AGT−/− animals; occludin staining (red) of wt mouse brain (top panels; 3 different microvessels shown) is more intense and continuous than occludin staining of AGT−/− (bottom 3 panels). Scale bar, 20 μm. b, Quantification of occludin strand peak fluorescence intensity and thickness in wt and AGT−/− brain reveals a marked decrease in AGT−/− animals (**p < 0.0001; mean ± SEM). c, x-y-z projection of JAM-1, claudin-5, and ZO-1 staining (all in red) in brain capillaries of wt and AGT−/− animals. x-y-z projections were reconstructed from 70–100 individual images acquired by confocal microscopy. Scale bar, 20 μm. d, x-y planar images of plasminogen and albumin immunostainings in the CNS of wt and AGT−/− animals. Scale bars: 50 μm; inset, 25 μm. TO-PRO3-stained nuclei appear in blue.