Figure 4.
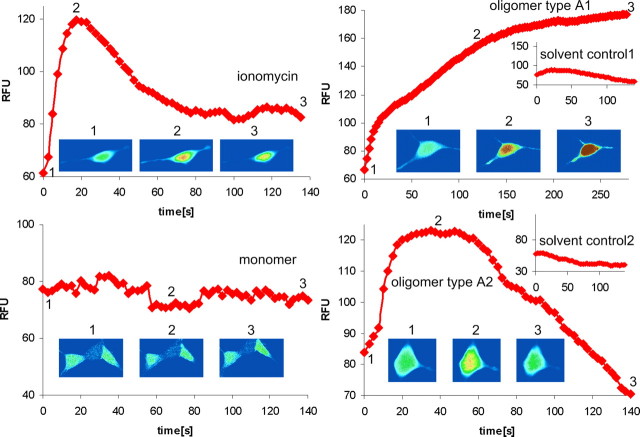
[Ca2+] elevation by α-syn oligomer types A1 and A2 in SH-SY5Y cells. Traces show [Ca2+]-dependent fluorescence of single SH-SY5Y cells overexpressing α-syn[wt] in response to 6 μm ionomycin, 0.1 mg/ml monomer, and 0.1 mg/ml oligomer types A1 and A2 with respective solvent controls. Oligomer types A1 and A2 evoked a clear increase in intracellular [Ca2+]. Fluorescence records illustrating typical responses to different treatments starting at the time point of application are shown. The inset images of the cell were captured at the times indicated during the trace and are depicted on a pseudocolor scale with “warmer” colors on a rainbow scale corresponding to higher fluorescence. The inset images show representatives of a single cell.

