
Figure 1.
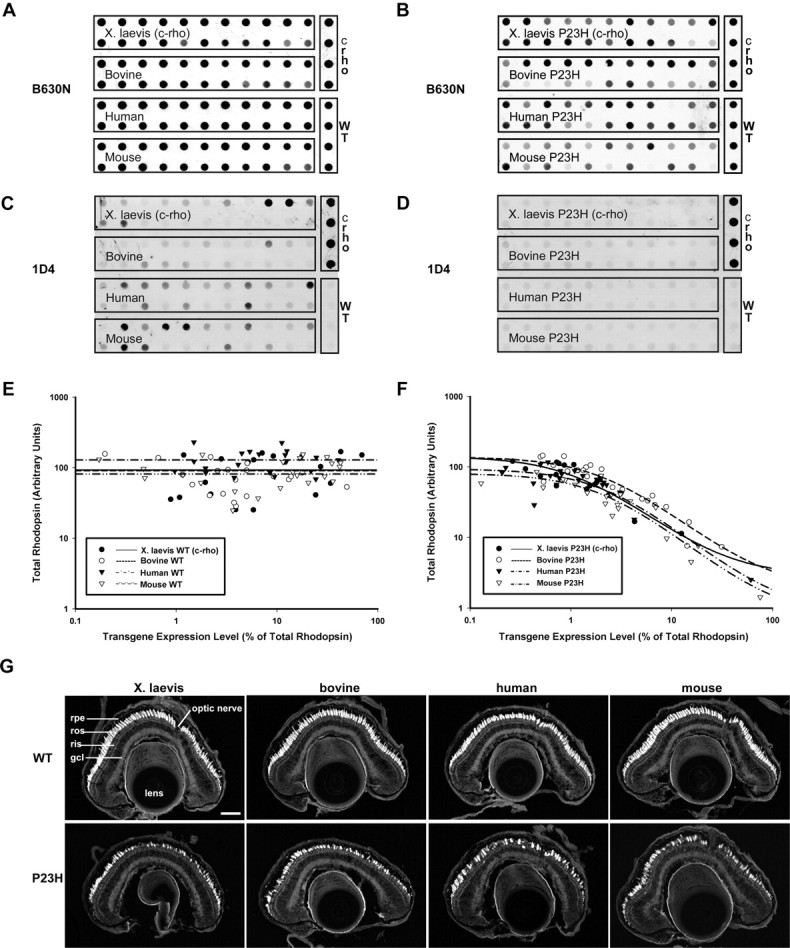
Quantitative and qualitative analysis of X. laevis retinas expressing WT or P23H rhodopsins from different species by dot blot and confocal microscopy. A–D, Samples of eye extracts from primary transgenic X. laevis expressing X. laevis, bovine, human, or mouse wild-type rhodopsins (A, C) or P23H rhodopsins (B, D) were dotted on membranes and probed with mAb B630N (recognizing total rhodopsin) or mAb 1D4 (recognizing transgenic rhodopsin). Samples containing 100% transgenic rhodopsin from transfected HEK293S cells (c-rho) and 100% endogenous wild-type rhodopsin from nontransgenic retinas (WT) were included as standards. Transgenic wild-type rhodopsins were expressed at a wide range of levels, whereas P23H rhodopsins were uniformly expressed at low levels. E, F, Fluorescent signals from dot blots were quantified and used to generate plots of transgenic rhodopsin expression level versus total rhodopsin. Regardless of species, expression of P23H rhodopsins resulted in diminution of endogenous rhodopsin levels indicative of RD, whereas expression of transgenic WT rhodopsins did not correlate with lower endogenous rhodopsin levels. G, Confocal micrographs of cryosections from transgenic retinas expressing WT (top row) or P23H rhodopsins (bottom row) stained with wheat germ agglutinin. The P23H retinas shown have intermediate levels of RD as indicated by both loss of rods and shortened ROS. gcl, Ganglion cell layer; rpe, retinal pigment epithelium. Scale bar, 100 μm.