
Figure 7.
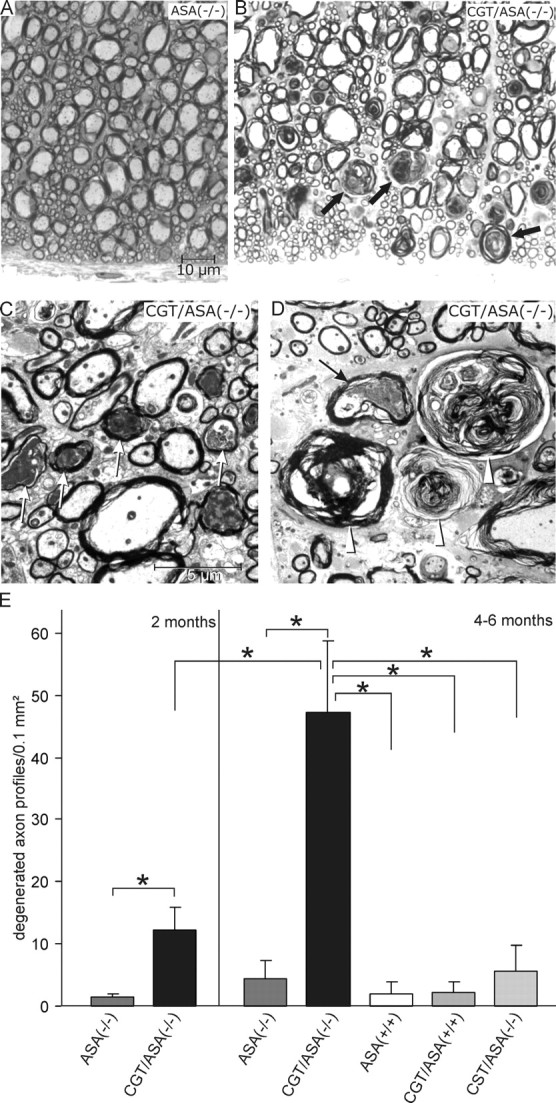
Degeneration of nerve fibers in the spinal cord (anterior spinothalamic tract) of CGT/ASA(−/−)mice. A, B, Toluidine blue staining of semithin sections showing the anterior spinothalamic tract. Genotypes are as indicated. In CGT/ASA(−/−) mice (B), numerous rosette-like myelin debris (some indicated by arrows) are seen, which are absent from ASA(−/−) mice (A). C, D, Electron micrographs of CGT/ASA(−/−) spinal cord. In C, several degenerating axons (arrows) are seen. In D, several concentric membranous whorls consisting of myelin debris (arrowheads) are seen, which correspond to the rosette-like structures observed at light microspopic level. The arrow in D points to a degenerating axon. E, Morphometric evaluation. The myelin debris in the anterior spinothalamic tract (in a test area of 0.1 mm2) as observed in semithin sections were quantified in mice of the indicated genotypes (age, 2 and 4–6 months). All data are expressed as mean + SD. Asterisks indicate a significant difference (p < 0.05, ANOVA followed by the LSD test). Scale bars: A, B, 10 μm; C, D, 5 μm.