Figure 5.

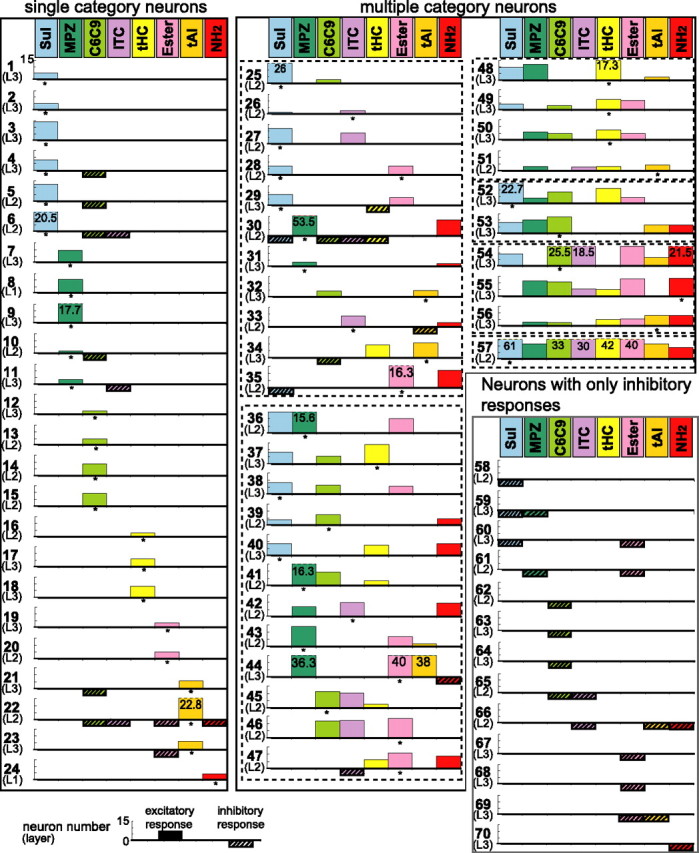
Odorant-category selectivity of individual neurons in the aPC. Based on the category selectivity, 70 odor-responsive neurons were classified into three groups: single category neurons (left box), multiple category neurons (middle and right top boxes), and neurons with only inhibitory responses (right bottom box). Individual neurons are shown by a thick horizontal line with neuron number. Layers of the recorded neurons are shown in the parentheses under the neuron number. L1, Layer 1; L2, layer 2; L3, layer 3. Statistically significant excitatory responses are shown by upward columns. Column size reflects the aMOR (see Materials and Methods). Truncated columns were shown by a ceiling with a broken line, and their aMORs are shown by numbers within the column. Statistically significant inhibitory responses are shown by downward hatched columns with the same size. Column size does not reflect the magnitude of the inhibitory response. For each neuron, the most adequate category that induced the largest excitatory response was indicated by an asterisk. Note a wide variety of category-profile selectivity of individual neurons in the aPC.
