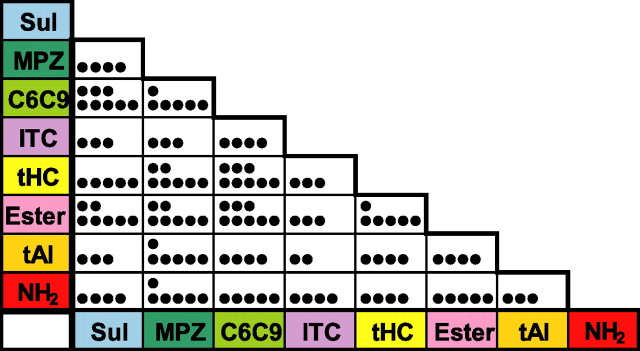
Figure 6.
A matrix representation of the number of recorded neurons that received excitatory inputs from a specific binary combination of the eight categories. The number of dots in each rectangle indicates the number of aPC neurons that responded to both the category shown at the horizontal axis (bottom row) and the category shown at the vertical axis (leftmost column). This matrix was based on the data of 32 multiple category neurons (excluding neuron 57) in Figure 5. Note that all of the binary combinations of the eight categories were observed in the recorded neurons.

